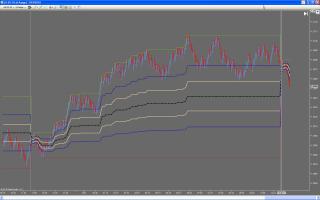
Basically, in real time, the key fib levels are plotted. It is similar to the BigMike's FibEnvelope but it only changes if a new high/low is made, otherwise the fib lines remain flat.
I use it for possible chop identification and in theory, possible targets for intrafib trades. Once prices close and hold below/above extreme fib lines, a possible mega bearish/bullish run is in the works. Not always, but it is a good signal to perhaps look for bigger runs.
I use it on NT7, not sure if it works on 6.5 or not.
Works on any range chart, time based chart, volume or tick chart.
Includes plots for HOD and LOD.
This indie requires a restart of Ninja.
The indicator shows up in the indicator window as "MyDynamicPivots" NOT Dynamic Fib Lines.
Here is a video on how to use it.
https://www.coiledmarkets.com/070910-WS/CM%20DynamicPullback1/CM%20DynamicPullback1.html
EDITED by max :
NT 6.5: not tested - not sure if it works on 6.5 or not.
NT 7.0: Yes
Category The Elite Circle
|
|
|


