IMPORTANT: Read before install. This is an Average DAILY range indicator, so you MUST have at least the number of days you are setting your ADR to compute an ADR. This includes weekends that don't have data. So if it does not work, MAKE sure you have enough days loaded. E.g., if you are trying to display a 14-day average, but only have 10 actual days of data(excluding weekends), the indicator will return a null value(∞).
------------------------------------------------------------
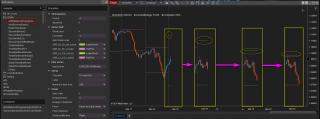
This indicator will display an ADR on your screen. It will also display projections of that ADR as the day progresses.
As the range is extended, the lines will adjust until the ADR is achieved... The lines will then LOCK in place, change color and remain FIXED for the rest of the session. The image attempts to show this.
The lines produced are projections, NOT predictions. The lines are simply the result of subtracting the ADR from the CURRENT daily High to plot the LOW projection, and the opposite to plot the HIGH projection. This is why the lines will adjust and shrink as the range expands.
Setting "AutoScaleLines" to true, will autoscale so that the lines are always in view on your chart. I.e., this will shrink the bars.
The on-Screen text should be self-explanatory, but the label of "complete" simply describes the current day's range as a percentage of the ADR. E.g., a value of 50% tells you the CURRENT day's range is 1/2 the ADR.
You can either on-screen display, lines or both.
The indicator will update in real-time, on each tic.
Note, installing this indicator will create a folder in your indicators called "BTMM", that's where the indicator will be.
->UPDATE(26Nov2020): V2 of Indicator. Added new Parameter called Last-Bar SmartFit. This parameter will push the ADR(the lines) to the LOD(Low of Day) or HOD(High of Day), on the LAST bar in the session. This will occur when the ADR is NOT achieved on that day.
It works by putting the range on whichever came FIRST(LOD or HOD). THis is mostly visual, as I like to see visually, by how much the ADR was missed. Mostly just an easier way to see historical data. This adjustment will ONLY occur on the LAST bar of the session.
THIS image below attempts to explain what the new parameter is doing.

Category NinjaTrader 8 Indicators and More
|
|
|


