Upon a new High or Low, the pullback column will consist of a single price level. If the market trades one tick away from the High, then the pullback column will consist of 2 price tick levels, a tick at the High price and 1 tick below it.
This is very useful to see what is happening on pullbacks to look for exhaustion or interest.
Press Ctrl+Space to reset.
Last update: 20 March 2025
P.S. I developed this on version 8.1.4.1 and i've been made aware that it does not compile on versions below 8.1
- V1 - Initial release
- V1.1 - Fixed reset on bar low
- - Press Ctrl+Space to reset
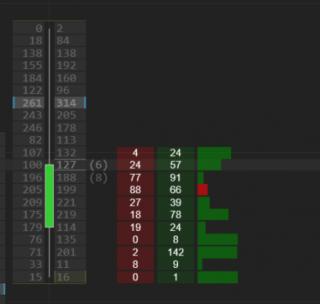
- V1.2 - Added a Delta visualization column
- V1.3 - Very small improvement of white border around row of current price
Category NinjaTrader 8 Indicators and More
|
|
|


