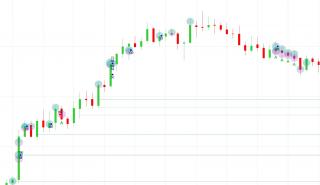
An advanced volume analysis indicator that identifies and visualizes significant volume events on your chart using dynamic or static thresholds. The indicator processes tick-by-tick data to detect unusual volume activity and displays it as colored circles or ellipses directly on the price chart.
Key Features:
- Dual Threshold Modes: Choose between Static (fixed volume threshold) or Dynamic (calculated based on recent volume averages)
- Real-time & Historical Analysis: Processes both live tick data and historical data for complete market analysis
- Visual Volume Events: Displays volume spikes as colored circles/ellipses with customizable size, opacity, and colors
- Buy/Sell Pressure Detection: Differentiates between buying and selling volume with distinct colors
- Smart Circle Merging: Automatically merges overlapping volume events to reduce chart clutter
- Flexible Shape Options: Choose between perfect circles or elliptical shapes that can stretch horizontally
- Advanced Scaling: Dynamic circle sizing based on volume magnitude with configurable scaling factors
- Performance Optimized: Configurable historical data processing limits to manage memory usage
Main Settings:
- Threshold Method: Static (fixed value) or Dynamic (multiple of average volume)
- Volume Multiplier: Sets how many times the average volume triggers an event (Dynamic mode)
- Shape Style: Circle (perfect round) or Ellipse (oval with customizable height)
- Circle Scaling: Radius, scaling factor, and maximum size limits
- Colors: Separate colors for buying vs selling volume events
- Historical Processing: Days to process and enable/disable historical analysis
Updates
Version 1.1 - Added the option to show imbalances
Version 1.2 - Performance optimizations
- Fixed buy/sell ratio for merged circles (color split)
- Addressed an issue where chart could freeze when zooming out quickly
Version 1.3 - Imbalances are now detected right after bar close, they initially were visible only after indicator reload.
Version 1.5 - Added possibility to adjust size of per level imbalances.
- Added dynamic opacity option (default) - delta around 50, circle is empty, high delta more opacity.
- You can filter out small volume orders with size filter, only bigger trades are taken into consideration. You may need to reduce the multiplier in dynamic mode to show more circles.
- Added option to display absoprtion - High delta, price doesn'nt follow in timeout (30s), plot letter A for absoprtion.
- Bug fixes
Version 1.51 - Fixed bug with Absorption timeout, now it plots the A for absorption only after the timeout set in settings is elapsed - works in live mode only.
Version 1.6 - Added the option to show 3 configurable order block sizes beside candlesticks, now you can spot big buy or sell orders without the need to check T&S.
Version 1.7 - 27.01.2026- Added the option to show delta map/bars, enabled by default, set threshold in settings.
Version 1.8 - 25.02.2026- Delta lines are mitigated when price closes above negative detla or below positive delta
- Orderblocks have now one size filter, with number of orderblock added beside it
Version 1.81 - 14.04.2026- Changed default delta strength threshold in absorption settings to 60%
- Added trapped traders section
Version 1.9 - 17.04.2026- Major code and rendering optimizations
Version 2.0 - 09.06.2026- Tick aggregation, dynamic threshold for delta bars, changed trapped traders logic, multiple bug fixes
Version 2.01 - 11.06.2026- Fixed bug causing very long load time mainly with tick aggregation disabled (set to 1), please udate to 2.01 if you have downloaded 2.0.
Category NinjaTrader 8 Indicators and More
|
|
|


