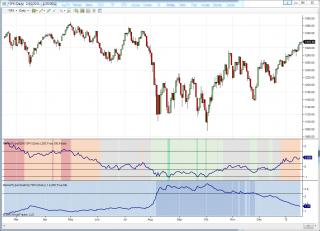
The basic idea is that these indicators could be used as a filter to determine which trading strategies work better when a given Market Type is prevalent. While his analysis is done specifically on the S&P 500 as the broader market definition, it should work equally well on other instruments.
This is my first NinjaTrader indicator so comments/suggestions welcome. This now includes both the SQN and Volatility indicators. The Volatility one for 2011, if you compare, looks "almost" the same as the one on the website linked below. I have looked back at old newsletters where they published the values for ATR% instead of the graph and my numbers match, so I will assume the formula is correct for now.
Enjoy.
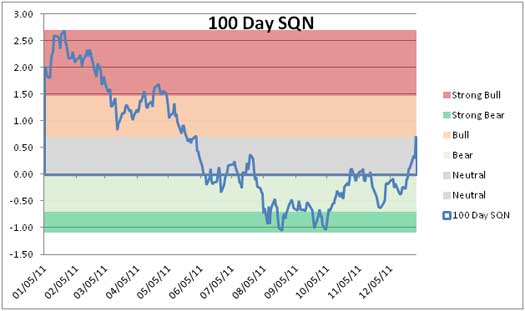
Here is a link to the latest newsletter article that has the SQN 100 graph of the S&P 500 for 2011. I have also included the graph from the article so you could easily compare it against the indicator screenshot over the same period.
https://www.vantharp.com/Tharps-Thoughts/Weekly_558_Jan_04_2012.htm

Changelog:
v1.1
- variable refactor
- paint background just in indicator panel
- for SQN i find 5 colors too much, so added a 3 color option so you can just see Bull, Neutral, and Bear market types.
Category NinjaTrader 7 Indicators
|
|
|
