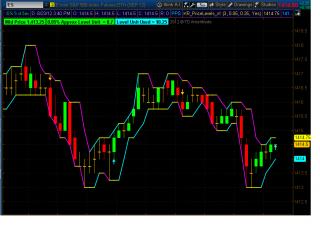
i needed something to help me spot common S/R levels and also watch price moves between levels of either % of price or in blocks of a certain dollar value (0.2, 0.5, 1.0 ... etc)
default is to show moves in increment of 0.5% of all-time (based on chart) mid-price, but can be changed to better suit the time aggregation and the underlying price range we're looking at (for shorter timeframe, you may want to look at $.25 levels, for a stock like AAPL you want to look at a $5.0 increments and so on)
The percentage level value is always approximated to the nearest multiple of $0.1 to make it meaningful.
if there's a setting in Override Range Unit, then that's the one the study will use as a unit for the incermental levels.
you can show/hide the levels calc details labels on top using the study settings.
found it interesting and it helps hide a lot of noise from price - also comes closer to my own view of Darvas so thought to share for the Range Chart & breakout trading fans..
Cheers,
RedK
Category The Elite Circle
|
|
|
