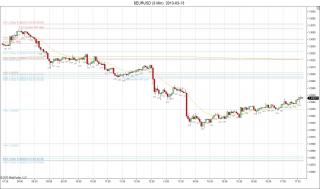
- swing highs and swing lows based on a swing defined as a bar with two bars to the left and two bars to the right which are all lower for a swing high (and vice-versa for a swing low)
- round numbers, e.g. 1.3500 in the EUR/USD. User-defined
- 2 sub-sessions/mini-sessions intra-day highs and lows, user-defined start & end times.
The lines are actually rectangles and I intend to add a function which will cause two close adjacent S/R lines to become just one zone.
I try to make the user-defined parameters self-explanatory from the description in the NT7 indicator set-up dialog underneath the parameter settings listing.
To discuss this indie and to offer advice or suggestions or ask what's what, please use this thread
Changelog:
2013-03-13: I just updated version 003 with some bug fixes
2013-04-24: another bug fix - version 003 r2 (because I have a version 4 already)
Last, a word of warning: I occasionally get mail from people asking what's gone wrong with the indicator because x, y or z is (or isn't) happening. This indicator has got pretty complicated and like I just said to someone just now, I'd need a full scale support operation to be able to help. All I can advise in this situation is to ditch the indicator off your chart and try reloading it. Sounds a bit like Microsoft Support, I know 
Category The Elite Circle
|
|
|
