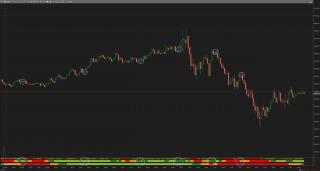
The idea is that your chart would be the "medium" time frame, and you would then select a lower and higher timeframe to compliment your chart.
- The indicator allows you to set the Gamma, Upper and Lower threshold for each Laguerre RSI
- The indicator allows you to select from any of Ninjatrader's built-in time settings
A long entry would look like this:
- Higher timeframe (lower bar) is showing long (preferably green)
- Chart timeframe (middle bar) has retraced and is showing orange or red
- Lower timeframe (thinner, topmost bar) is crossing back to yellow or green
The default colors are setup like so:
Red - Below the 20 line of the Laguerre RSI (or can be set to your own value)
Orange - Between the lower line and 50
Yellow - Between 50 and the upper line
Green - Above the 50 line
At this time the indicator does not plot a signal, but it most likely will in the near future.
NEW:
3 new signal plots have been added for use with Strategy building. Line1, Line2, and Line3 will return values of 1-4 depending on how they are plotting. All signaling "buy" would be a 4,4,4 combination, and "sell" would be "1,1,1". A pullback for a long entry might look something like "1,3,4", depending on the way you have your lines arranged.
Changelog
- 1.00 - Initial release
- 1.10 - Updated first line width
Added ability to change position of the line representing the chart time frame
Added new plots for tracking signals
- 1.11 - Bug fixes for new plots
Category The Elite Circle
|
|
|
