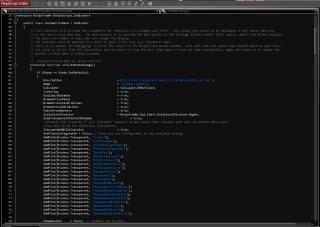
When you select the indicator in the strategy builder or the chart alerts, you can change the plot to any of the 20 other plots so you can work with the statistic of interest.
Also, all 21 plot values will show in the charts data box window or the charts mini data box.
The indicator must be applied to a chart or data series that uses Volumetric bars. You must have the NinjaTrader lifetime license to access the Volumetric bars.
There is an option, for debugging, to print the output to the Ninjascript output window. This will show two values that should match on each line. One value is direct from the calculation and the other is from the plot (that gets it from the same calculation), the point is to remove the mystery of what data is being provided.
Category The Elite Circle
|
|
|
