Welcome to NexusFi: the best trading community on the planet, with over 200,000 members Sign Up Now for Free
Genuine reviews from real traders, not fake reviews from stealth vendors
Quality education from leading professional traders
We are a friendly, helpful, and positive community
We do not tolerate rude behavior, trolling, or vendors advertising in posts
We are here to help, just let us know what you need
You'll need to register in order to view the content of the threads and start contributing to our community. It's free for basic access, or support us by becoming an Elite Member -- discounts are available after registering.
-- Big Mike, Site Administrator
(If you already have an account, login at the top of the page)
I have a couple issues with the back testing "Strategy Performance Summary"
Excessive information spread over heaps of screens. Even after exporting to Excel
There is no analysis of the Exits Strategies ie how many times the Initial Stop/StopLoss was hit, Breakeven hit, Trailing Stop etc
So to this end, I created a spreadsheet that loads in the information from a "Strategy Performance Summary" and produces a single page report with what I feel is the critical information.
I am wondering if you could work some Excel magic for the Optimization report. I would like to build a custom Equity Curve in Excel for each run within the optimization report. This is because I want to optimize based on Equity Curve, and not based on net profit, win %, etc etc.
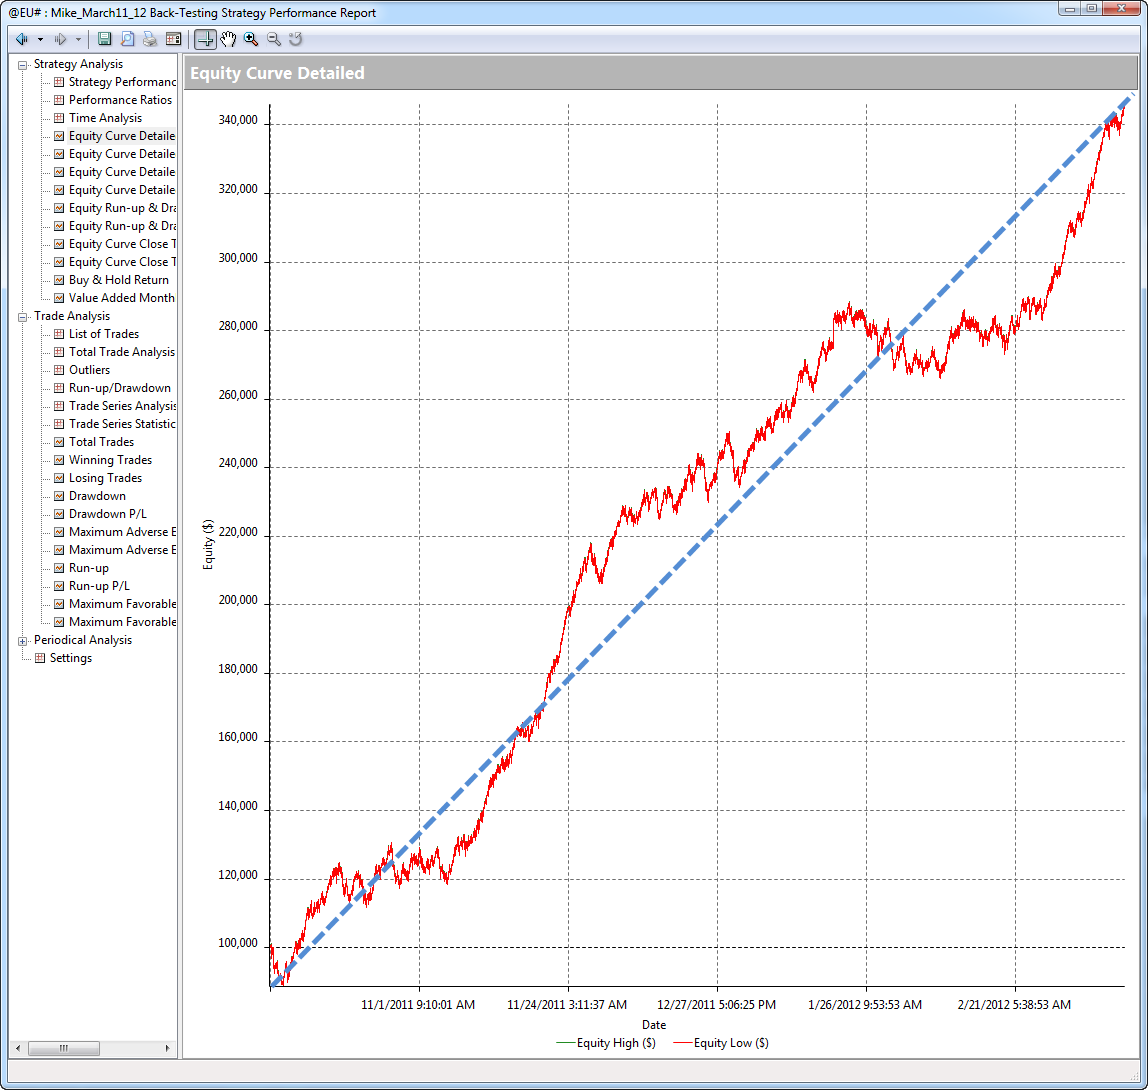
Take the above example, I would like to be able to visually glance at dozens or hundreds of EQ images and pick the one that is optimized "best" (closest) to the smooth linear blue line shown in my screenshot.
If there was some kind of a connection into the report, it may be able to be done. But I think it only generates the report and thus graphs after a optimization has been completed and the inputs selected.
I think we need some insights from Multicharts on how best to achieve this.
My condensed report, just rips apart an export excel export and condenses it.
Would this be better produced from within the signal ie generate a text file with the equity curve for this run and then change the input values and run again. Auto changing of the input values would be desirable along with the value some how used within the file name. I don't know if a refresh can be generated some how?
After that, reading the text file into excel and generating the charts could all just be the press of a single button.
Another one: MultiCharts Project Management - Issue MC-854 - Add preview image of Equity Curve for each result in Optimization report (
This one is very important to me.
Mike
As for exporting csv values from the signal, I am not sure what all would need to be exported to properly build an EQ in Excel. My head starts to spin when I try to graph that kind of stuff in Excel.
It's easiest for us to input logic for generation of the report inside the program. All the numbers are readily available in MC, just a matter of how to combine them and what to show. We also can't completely get rid of the one we currently have, as some people depend on it. So, there is a possibility, for an additional report. A complete schematic of what you want to see, a blue print, would be a start to looking at this.
MultiCharts - Raising the Trading Standard.
Please send me a private message if you have any further questions about MultiCharts
I have a couple issues with the back testing "Strategy Performance Summary"
Excessive information spread over heaps of screens. Even after exporting to Excel
There is no analysis of the Exits Strategies ie how many times the Initial …
The chart is the close to close of the equity curve.
The Exit strategy section is a count of how many times a specific order label was generated.
As an example, I call the Long Trailing stops "TS_LX" and the shorts "TS_SX"
At the moment, in the all trades area of the spread sheet, I do a count to see how many times TS_LX is hit.
The idea being that I get a good feel for what is causing my trades to exit.
So in your Long and Short columns, where I just have the count, you could put (TS_LX) = 8 and (TS_SX) = 8
Ie put the order name in brackets and the count beside. I guess the same could also be done for the entry orders.
A two page report would be fine. Basically the area below the chart would all move to the second page.
This would allow the printing of all signal names being used by the system and their corresponding inputs. At the moment, the existing report (yours and mine) doesn't show what signals were used for this strategy. Just a long line of un-named parameters.
This now gives a single piece of paper (printing on both sides) with a very good feel of how good/bad the system is.
Actually, the average MFE and average MAE for long and shorts, would also be good to have displayed on the first page. This gives a good idea of Stoploss and trailing stop placement.
Hi Mike,
So how did you go with the above?
I've done some EL code that will generate a series of CSV files ie a MA cross over entry with a test of the MA from 10..30. This means 20 files each with it's own equity curve.
Turn the Strategy ON and let it go. Out pops 20 CSV files.
Neil.
I created the project management request, requesting to be able to optimize against a linear equity curve with the smallest deviation from "perfect". Same request also asks to be able to see the EC at a glance from the optimization parameters result screen.
I am moving forward with a live market forward test of that strategy shown in my post. >100k trades in the last 2 years, and strategy performs similarly across different markets and time frames.
So I've not reached any conclusions just yet, not until after more forward testing in a cash market. The forward tests in a simulated market have been good.


 please add the below..