|
Taipei
Experience: Beginner
Platform: NT
Broker: IB
Trading: ES
Posts: 8 since Jul 2018
Thanks Given: 1
Thanks Received: 2
|
Hi everyone,
I have two data series on a QQQ daily chart:
QQQ @ daily
QQQ @ weekly (invisible candle)
I have created a default EMA (Mov_Avg_Exponetial) with same period on both QQQ_daily and QQQ_weekly data series
EMA_daily = CYAN
EMA_weekly = RED
I have created the same EMA using ToS. (attached image).
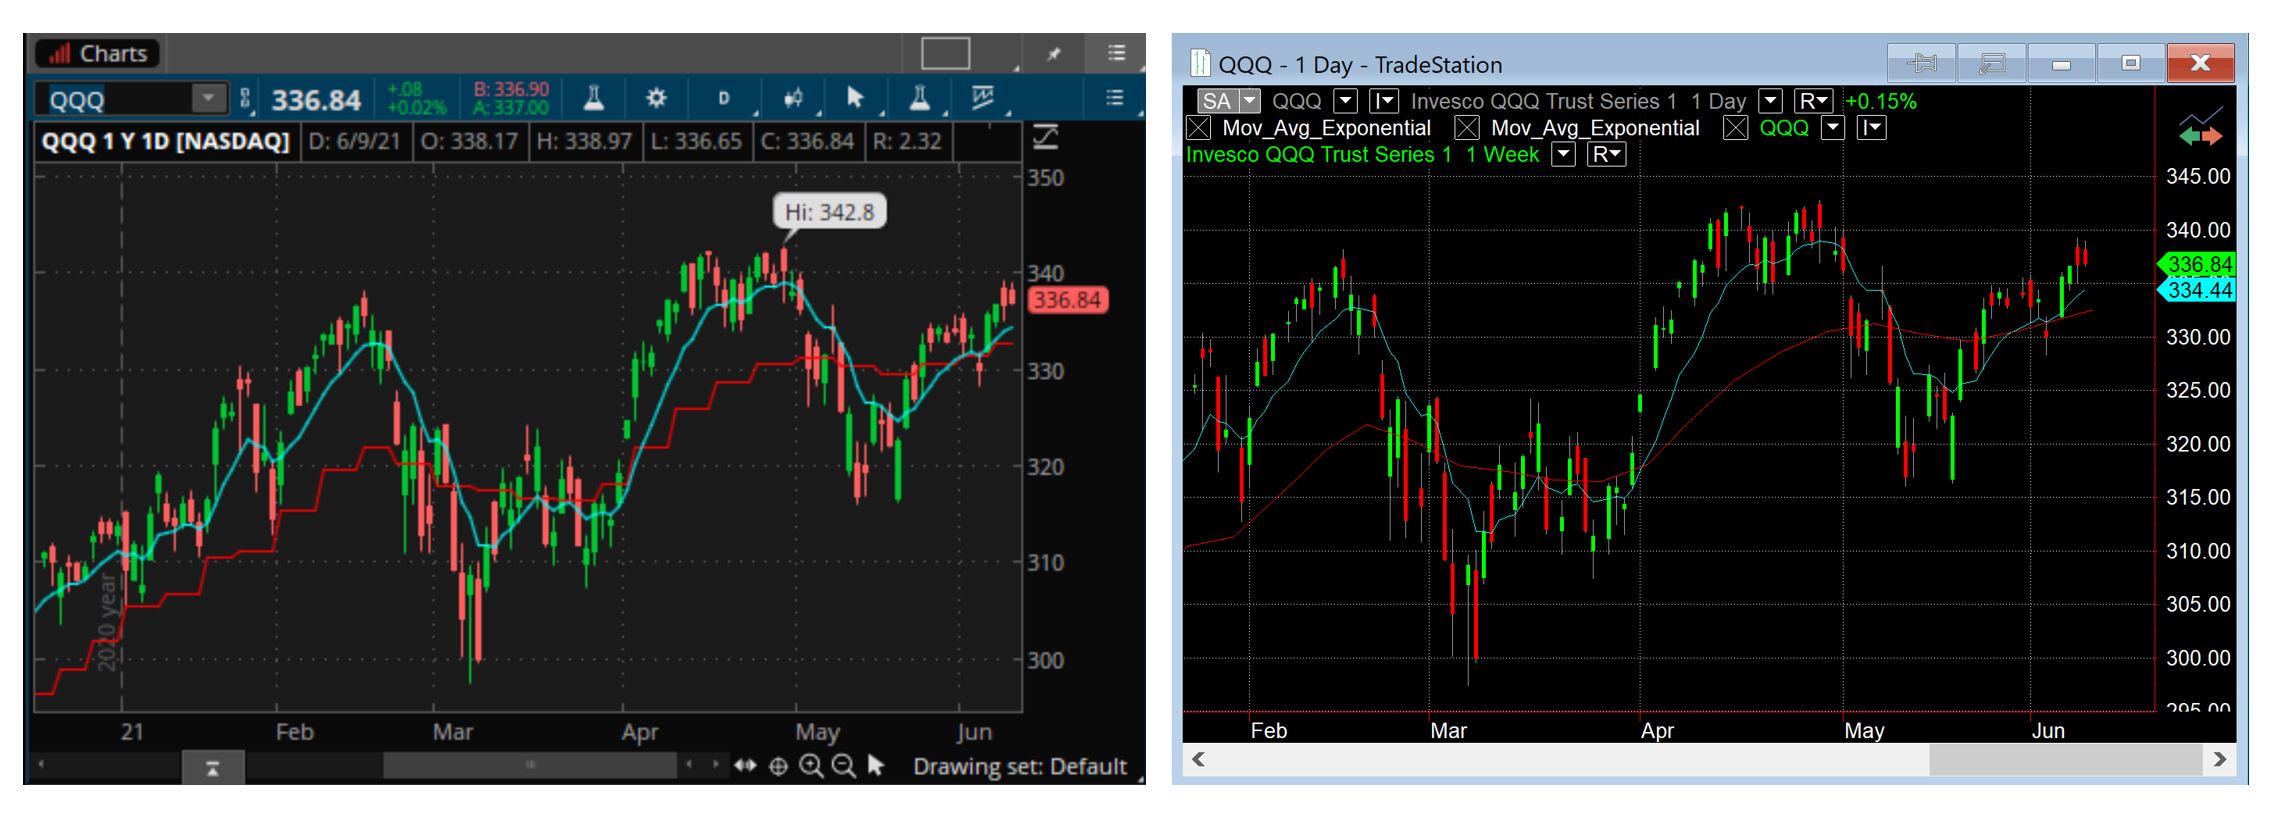
As you can see, the EMA_weekly_RED from ToS has a sort of "stepped line" instead of the "smoothed line" in MC. Why is that?
I think other trading platforms also generated this kind of "stepped line" when imposing higher timeframe lines onto lower timeframe chart.
Is there anyway we can make the MC's EMA to generate the same "stepped line" as in ToS?
Thanks guys so much for your kind inputs and helps!
|


