NexusFi: Find Your Edge


Home Menu


Welcome to NexusFi: the best trading community on the planet, with over 150,000 members Sign Up Now, It is Free
  • Genuine reviews from real traders, not fake reviews from stealth vendors
  • Quality education from leading professional traders
  • We are a friendly, helpful, and positive community
  • We do not tolerate rude behavior, trolling, or vendors advertising in posts
  • We are here to help, just let us know what you need
You'll need to register in order to view the content of the threads and start contributing to our community.  It's free for basic access, or support us by becoming an Elite Member -- see if you qualify for a discount below.

-- Big Mike, Site Administrator

(If you already have an account, login at the top of the page)


VOLCumulativeDisparityMeter - howto


Discussion in Platforms and Indicators

Updated
    1. trending_up 183 views
    2. thumb_up 4 thanks given
    3. group 1 followers
    1. forum 1 posts
    2. attach_file 1 attachments


Search this Thread

VOLCumulativeDisparityMeter - howto

(login for full post details)
  #1 (permalink)
 
trendisyourfriend's Avatar
 trendisyourfriend 
Quebec Canada
Legendary Market Wizard
 
Experience: Intermediate
Platform: NinjaTrader
Broker: AMP/CQG
Trading: ES, NQ, YM
Posts: 4,520 since Oct 2009
Thanks Given: 4,144
Thanks Received: 5,982

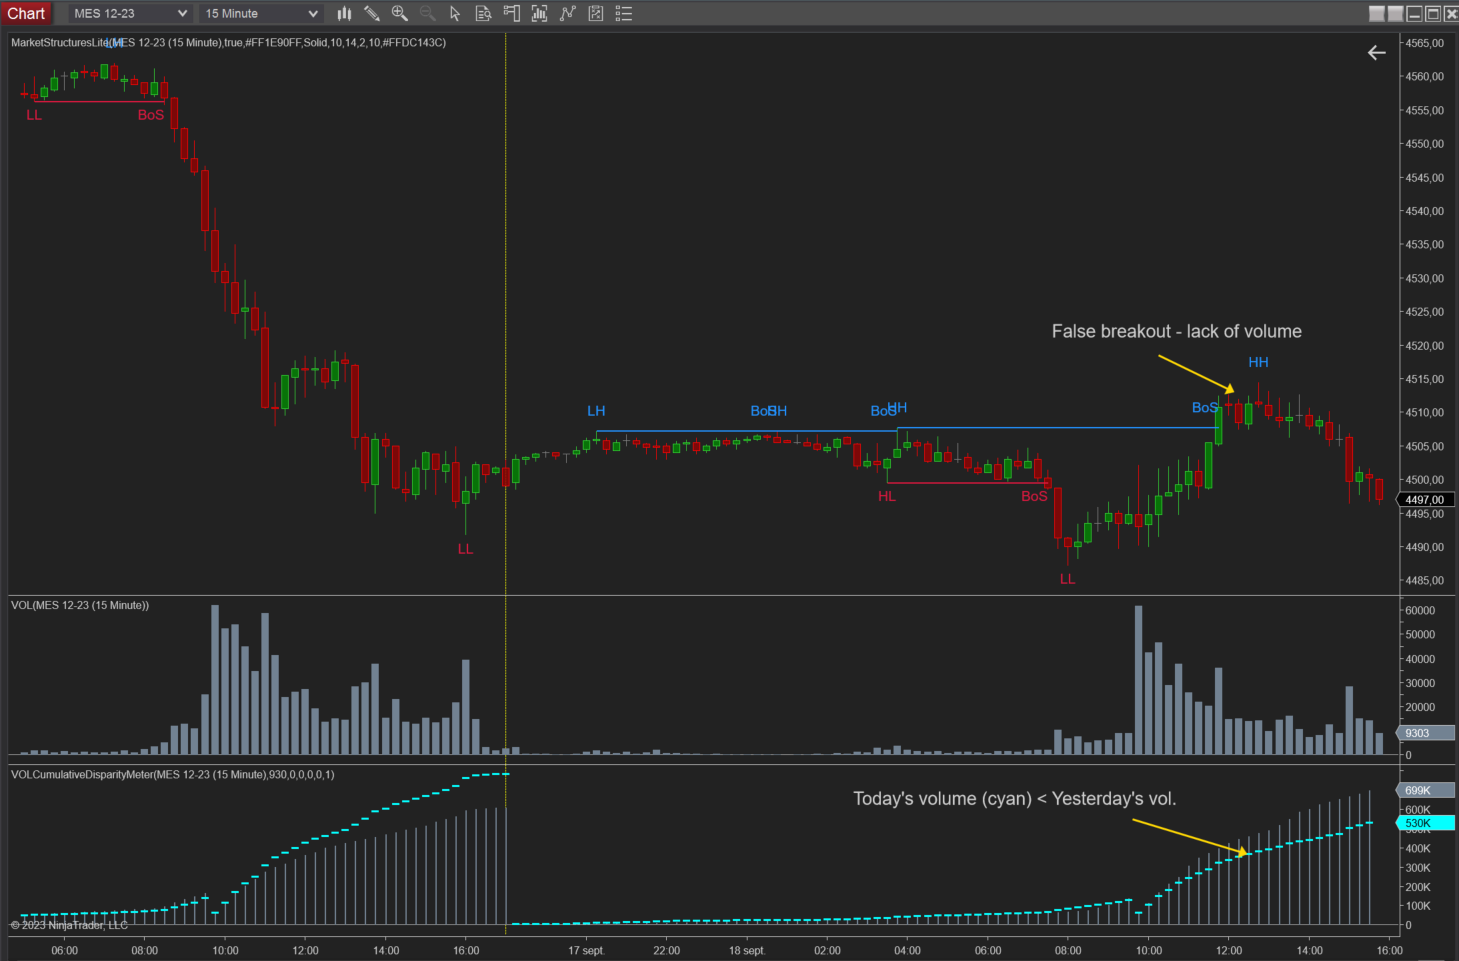
I've posted an update for the indicator 'VOLCumulativeDisparityMeter.' Many have asked how to use it, so here's a brief guide:

This indicator falls in the same category as the relative volume indicator. It assesses today's activity level relative to historical data. You can select the amount of historical data you want to compare by adjusting the 'Period' parameter.

For instance, if you want to compare today's volume to yesterday's, simply enter '1' in the 'Period' field. If you wish to compare today's volume to the average volume of the 14 prior days, enter '14.'

The session volume accumulates as the day progresses on a bar-by-bar basis, displayed as a histogram in a separate window. The average historical cumulative volume appears as a bar graph, while today's volume or session cumulative volume is represented as a hash cyan line (default settings) overlaying the bar graph.

You can set up to five reset intervals to begin a new volume accumulation for different time windows. You must specify the reset interval as a number of minutes for reaching the desired time from the start of the session. (TIP: you can use the Ruler to find the number of minutes between the session open and your desired reset time)

For example, if your chart's trading hours uses the 'CME US Index Futures ETH' template, and you want to split today's session cumulative volume for the overnight and regular trading hours, fill one of the 'Intra Session Interval Reset' field with '930' as the number of minutes.


If already downloaded, please replace with new update:
https://nexusfi.com/local_links.php?linkid=2674

Started this thread Reply With Quote
The following 4 users say Thank You to trendisyourfriend for this post:

Can you help answer these questions
from other members on NexusFi?
EARNMAX Scam
Trading Reviews and Vendors
How to create strategy utilizing divergence between two …
Sierra Chart
BollingerPro discussion
The Elite Circle
Resources to help learn about diversification of algo po …
NinjaTrader
NT8 PnF Crowd Funding
NinjaTrader
 

(login for full post details)
  #2 (permalink)
 
trendisyourfriend's Avatar
 trendisyourfriend 
Quebec Canada
Legendary Market Wizard
 
Experience: Intermediate
Platform: NinjaTrader
Broker: AMP/CQG
Trading: ES, NQ, YM
Posts: 4,520 since Oct 2009
Thanks Given: 4,144
Thanks Received: 5,982

I have updated this indicator.

A fix has been applied for dealing approprately with a partial holiday.

Current version is v1.02

Started this thread Reply With Quote


Last Updated on September 21, 2023


© 2023 NexusFi™, s.a., All Rights Reserved.
Av Ricardo J. Alfaro, Century Tower, Panama City, Panama, Ph: +507 833-9432 (Panama and Intl), +1 888-312-3001 (USA and Canada)
All information is for educational use only and is not investment advice. There is a substantial risk of loss in trading commodity futures, stocks, options and foreign exchange products. Past performance is not indicative of future results.
About Us - Contact Us - Site Rules, Acceptable Use, and Terms and Conditions - Privacy Policy - Downloads - Top
no new posts