Welcome to NexusFi: the best trading community on the planet, with over 150,000 members Sign Up Now for Free
Genuine reviews from real traders, not fake reviews from stealth vendors
Quality education from leading professional traders
We are a friendly, helpful, and positive community
We do not tolerate rude behavior, trolling, or vendors advertising in posts
We are here to help, just let us know what you need
You'll need to register in order to view the content of the threads and start contributing to our community. It's free for basic access, or support us by becoming an Elite Member -- see if you qualify for a discount below.
-- Big Mike, Site Administrator
(If you already have an account, login at the top of the page)
Average daily range is basically ATR correct? Good points and thanks again. Edited follow. Would you use the same 10 days for stop. I ask because sometimes, CL, other side of OR is $$$.
The average daily range is just the arithmetic average of the range for the last n days. The average true range uses the formula modified by Welles Wilder. If yesterday's close is within today's range there is no difference.
For the ETH sessions they are nearly always identical. However for the RTH sessions there may be a difference. For example today's ADR(RTH) uses the low of today's RTH session (1276), the ATR uses yesterday's close (1270.50) instead.
The vola bands on the chart refer to ETH and are built from a 3-day and a 10-day ADR.
I do no think that they match the value published by Mark Fisher. I have another project to locate these breakout values, based on the daily noise level (moves from the open that failed as a breakout). I also use the 3 day rolling pivot range on my 60 minute chart to locate major support and resistance. Both NoiseBands and RollingPivots can be found in the download section of this forum for NinjaTrader.
The indicators of the thread are MetaTrader indicators, I cannot read them. Maybe you could post some charts and explain, how you use the opening range and the A and C values.
I have also worked on the Logical Trader approach and coded an indicator, which automatically displays pivot range, opening range (period selectable), and A and C values. The charts attached show the price action of yesterday for TF and CL. I am not convinced that the method, which dates back to the 1990's can be traded today without modification. These are the parameters to be modified
-> duration of opening range, as markets have become faster
-> calculation of A and C values should be based on statistical data from the preceding 50 or 100 days
Thanks for posting. Some similarities and differences:
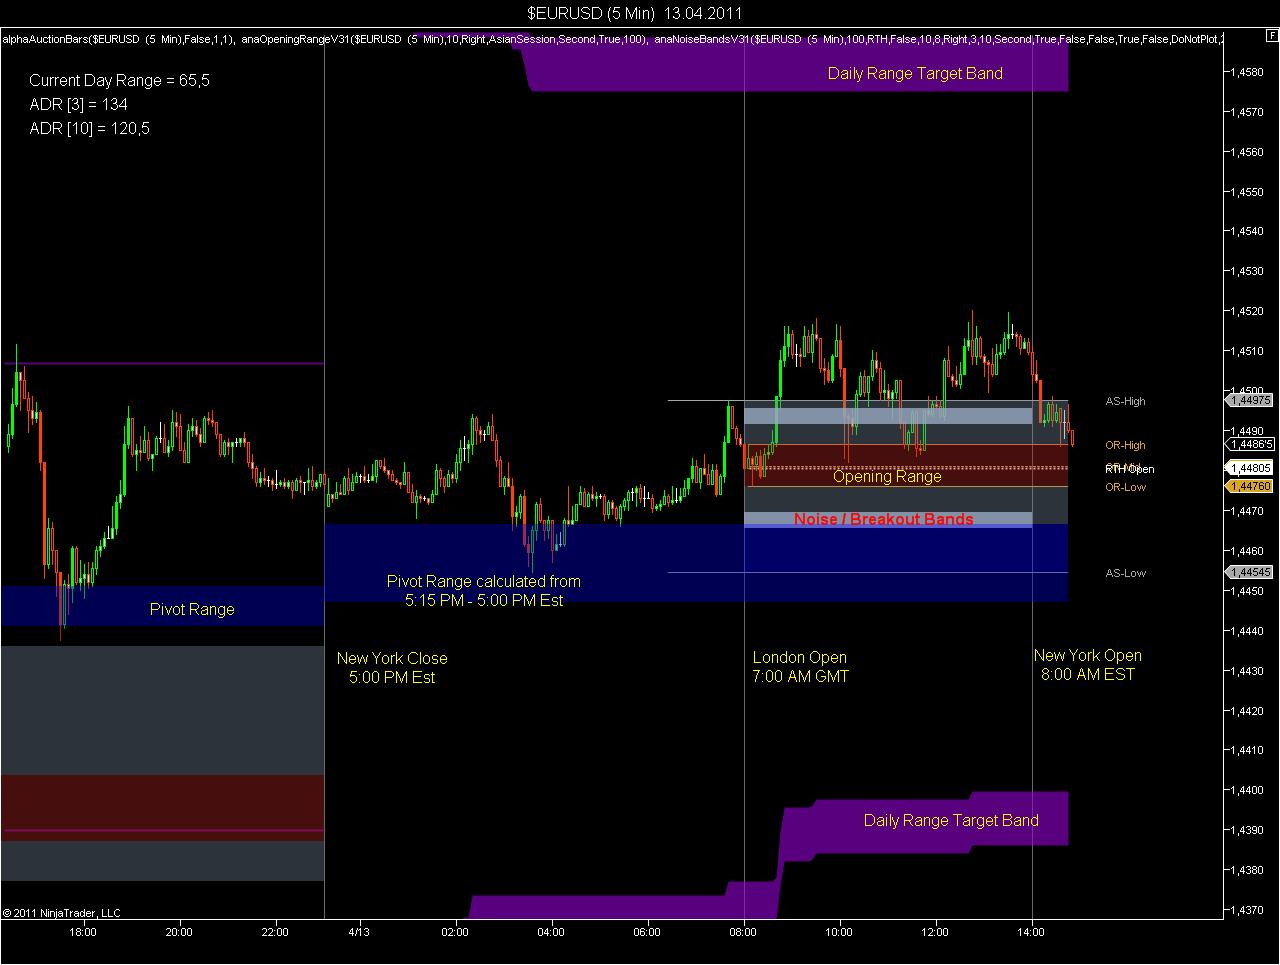
I calculate pivots from 5:15 PM Est to 5:00 PM Est (based on the New York Close).
Also have my European Open for the FOREX market at 7:00 AM GMT. That is when volume picks up. NinjaTrader has session templates so I use three sessions: 5:15 PM Est to 7:00 GMT, 7:00 AM GMT to 8:00 AM Est and then 8:00 AM Est to 5:00 PM Est.
For the breakout, I currently rely on noise bands. The noise is a multi day average of the smaller of (High - Open, Open - Low). For example if EURUSD counted from the London open first makes its daily low 30 pips below the open and then makes its daily high 60 pips above the open, 30 pips is the noise. The indicator calculates the average noise over the last M and N days and displays this as a noise band.
I am only taking a breakout against the pivot during the US session (not shown), and if the target band had been reached during the European session. The daily range target bands are based on the average daily ranges as shown in the upper left corner of the chart.
It is a volatility break idea developed during a trending market. To me the reason The Logical Trader is still a good book to read is because it teaches the difference between running a system vs random trades with no context.
Like Fish says in one of those nymex videos....it was blah blah up..so I had to take it.
My best swing trade yoy so far has been a bull flag on gold even though I've been waiting to buy LEAPS puts on GLD for 2 years. If I see a flag, I take it, unless it is some total and utter rubbish. Swing trades I trade trends on flags and that is it. That is my "system" that filters out what to look at for me.
ORB is nonsense though at this point. It is pit stuff.
If you are going to commit to it, you should be looking to expand it to overnight range breaks, volatility breaks on asia/europe..ect.
Moving pivot avg will work as well as the random line theory thread on this board.
The ultimate goal should be to read the tape/order flow like Tudor Jones as a cotton trader and PTJ mentor in the cotton pits. Fish even admits that.
(1) There is an indication prior to the open, whether volatility could be up or down. This includes prior range, news, implied volatility and the difference between price and value (pivot range)
(2) Opening range breakouts may well work, if you know at what distance from the open they typically fail. You can take the failure trade, and if it fails, you can trade the breakout. Just need to determine the best distance from the open for that trade. I think we should do an indicator that calculates the statistical distribution of moves from the open for each distance that price has already travelled. Then determine the maximum profit potential. Not easy though.
(3) Rolling pivot ranges work quite well, if you know how to read them. They convey information on potential volatility, trend and act as support/resistance, in particular the balance point.
My A and C values do not match Fish's values. But they include a dynamic component - the daily ATR's. 30 for longterm and 10 for short term. My daily bias is based on Fish's Numberline concept acc. 12 Days NL and acc. 30 Days NL . Furthermore I use the Trade and Facde concept - given by the PDF file (Link above).
regards ines
PS: My original member name is banned - maybe because the empty postings. That 5 Posting rule is useless.
It makes certainly sense to include a dynamic component, and the daily range or average true range is a point to start with. 10 and 30 days should work, except for the beginning of the year, when the 10 day ATR may just reflect the low volatility of the holiday season.
My plan is to modify the indicator (as posted above) to use different concepts for A and C levels.
-> one using implied volatility (this is only possible for instruments where there is a volatility index readily available, which is calculated from options
-> one using the noise bands
The noise bands should typically represent a fraction of the ATR. You mentioned that you use 10% for the A levels and 15% for the C levels. But your calculations start from the edge of the opening range, whereas the noise bands start right away from the open.
Open Questions
(1) One thing I did not get so far: Why are the C levels generally further away from the opening range than the A levels? Does anybody know, what triggers the different cases
(a) A level smaller than C level: for example 6E, 6B and most instruments
(b) A level equal to C level : for example 6A, 6C, NG
(c) A level larger than C level: for example ES, FESX, NQ, FGBL, GC, ZW
(2) If I look at the A levels I want to find out the threshold for a failed breakout. So in terms of expectancy there should be a local extremum maximizing the potential outcome until the exit of the trade, which could be anything between the high (long setup) respectively low (short setup) and the close.
This can be achieved by only using daily data, if the threshold is counted against the open instead of the opening range. Just find the mode of the value SUM(high/2 + close/2 - threshold - slippage) with high> threshold for all long setups, where the threshold is modified in 1-tick steps to get the distribution of results.
In a second step a filter could be applied, whether the breakout was supported by the pivot range, against the pivot range or breaking through the pivot range, where the pivot range stands for yesterday's value.
(3) A concept for the C level would be similar, just one would need to add a filter requiring a failed A. So again a problem of finding the mode of a cumulative distribution, but this time filtered, as only the failrues of A are selected. This cannot be done with daily data, as the daily data will not tell us, which of the two events, breakout to the upside or brealout to the downside took place first.
(4) I understand the number line concept, but have one question. Why should I look at anything 30 business days ago? This assumes a fixed cycle with a length of 6 weeks. But there is no such thing as a cycle with a fixed length. See charts attached.
>>>>>(1) One thing I did not get so far: Why are the C levels generally further away from the opening range than the A levels? <<<<<<
According to Fish - there is no C level for shares.
Definition on page 240: C values A specific number of ticks that is used to determine the distance to a Point C up (C ^) or a Point C down (C v). C values will vary depending upon the commodity or stock traded. In commodities, C values are different than A values (see A values). In stocks, A and C values are the same for each stock.
For all other instruments with C - there is just ONE A per day - let's say an intraday reversal occurs after an good A up - so the next valid ACD pattern would be the C down. If the session close is below C down - the macroindicator Numberline value would be -4.
As far as I remember the book and videos - A is never bigger than C.