Welcome to NexusFi: the best trading community on the planet, with over 150,000 members Sign Up Now for Free
Genuine reviews from real traders, not fake reviews from stealth vendors
Quality education from leading professional traders
We are a friendly, helpful, and positive community
We do not tolerate rude behavior, trolling, or vendors advertising in posts
We are here to help, just let us know what you need
You'll need to register in order to view the content of the threads and start contributing to our community. It's free for basic access, or support us by becoming an Elite Member -- see if you qualify for a discount below.
-- Big Mike, Site Administrator
(If you already have an account, login at the top of the page)
he said he uses ewave and fibs to create his grid he may as well say he uses random number to create it. Unless he hands you his computation you will never get exact same levels.
i mean you can see the computation in the code im guessing.. there are a few diff types of computations you can use on some of the harder to find waves of the instruments he did research on. he goes back(most of them 2001-2202 i think were the years) where the first major futures wave was first started, then he uses fib computations from there to project out major and minor fib lines. in the video on that page he explains it in more detail. all of the lines will always be on the chart above and below to matter what, they never change.. the only random lines are from the start of the first major initial wave pattern of the the instrument, then projected outwards using his fib calculations..
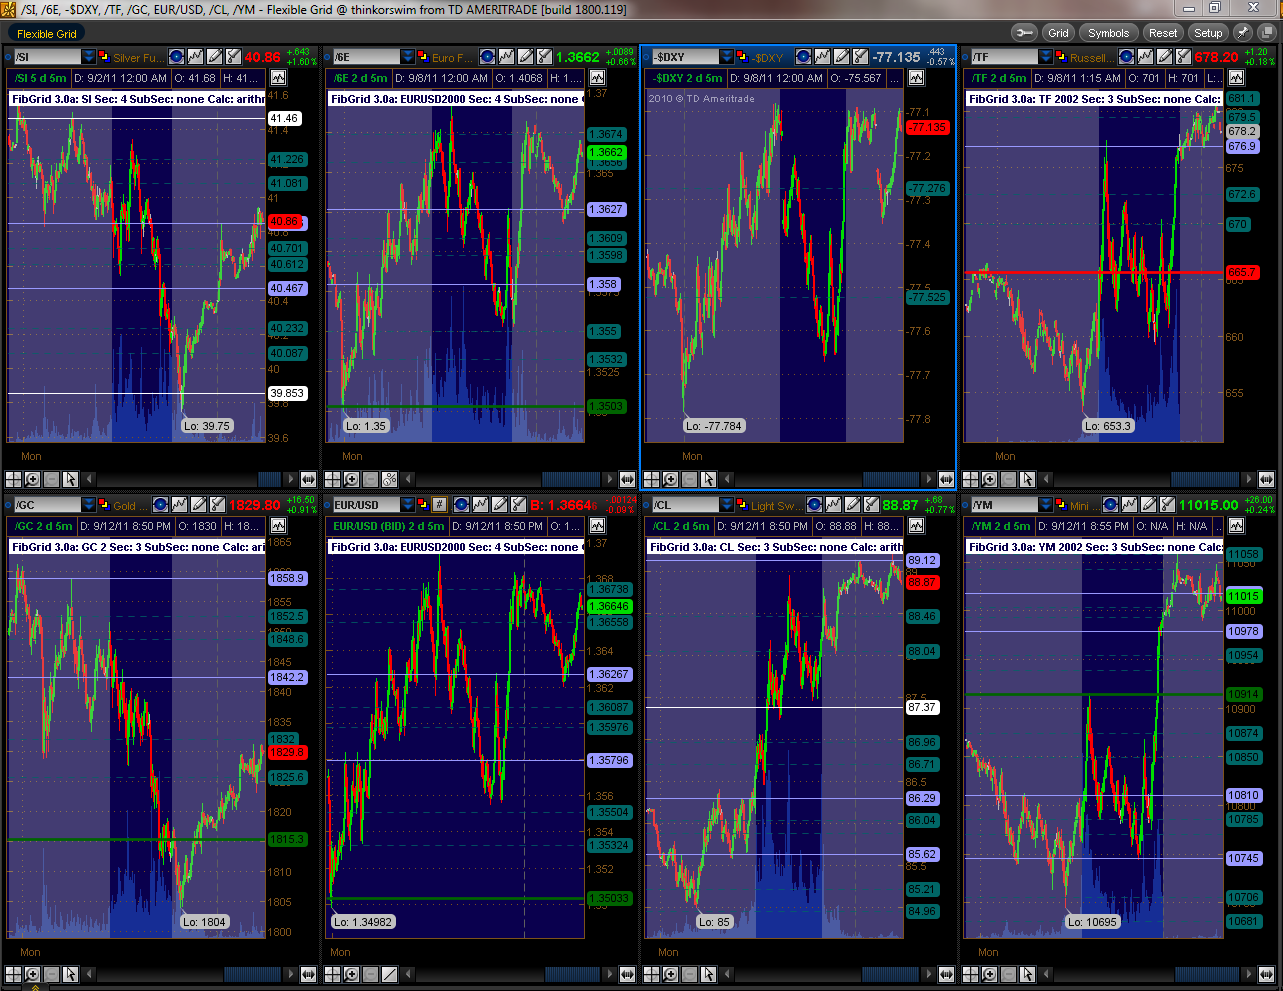
here is a quick snap shot of a few days ago(last time i opened TOS to check on em).. those lines are plotted from price action 10 years ago..:
dont believe anything you hear and only half of what you see
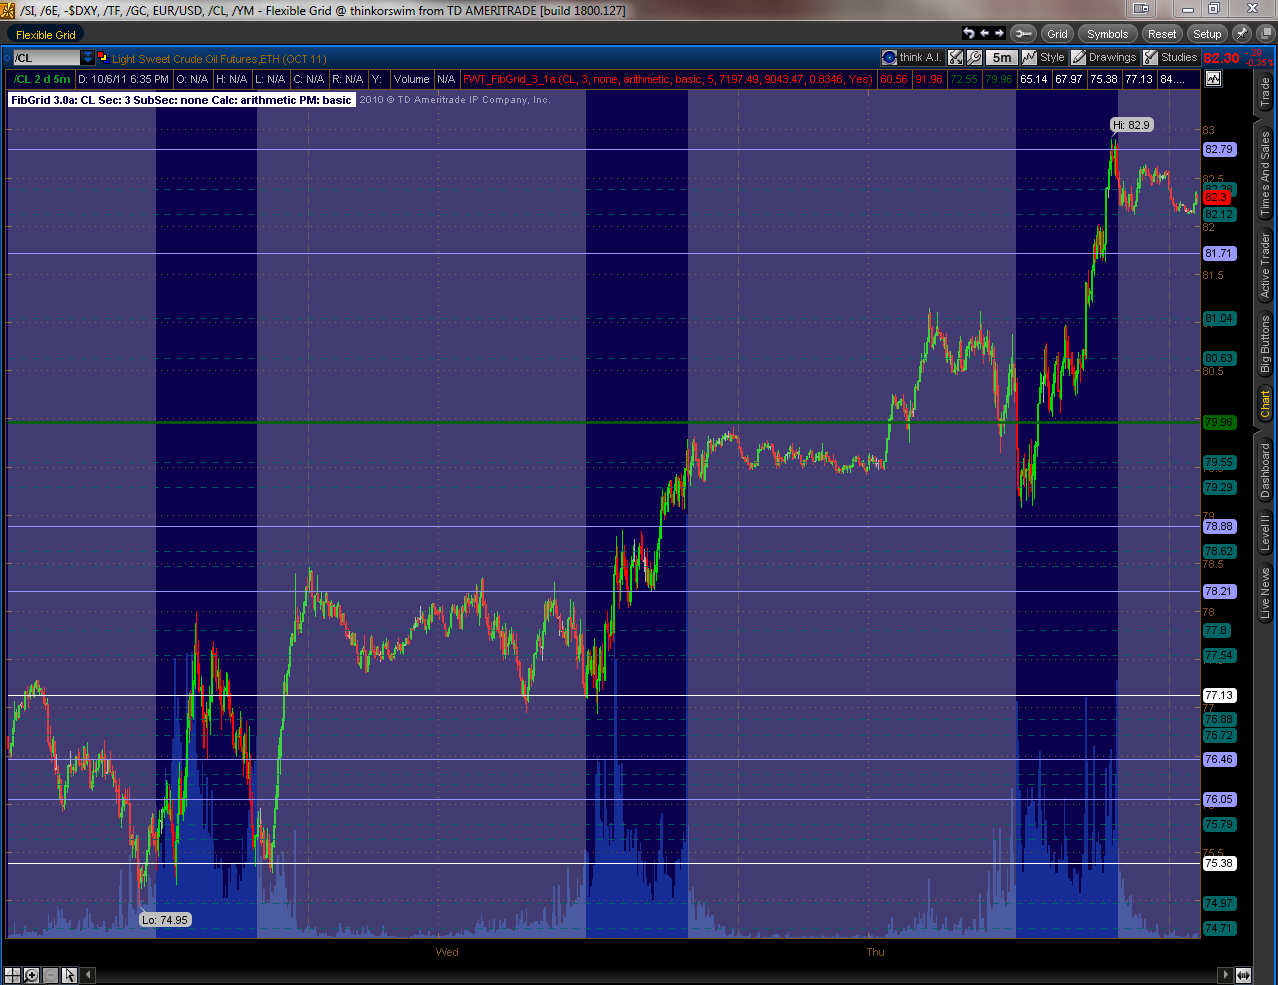
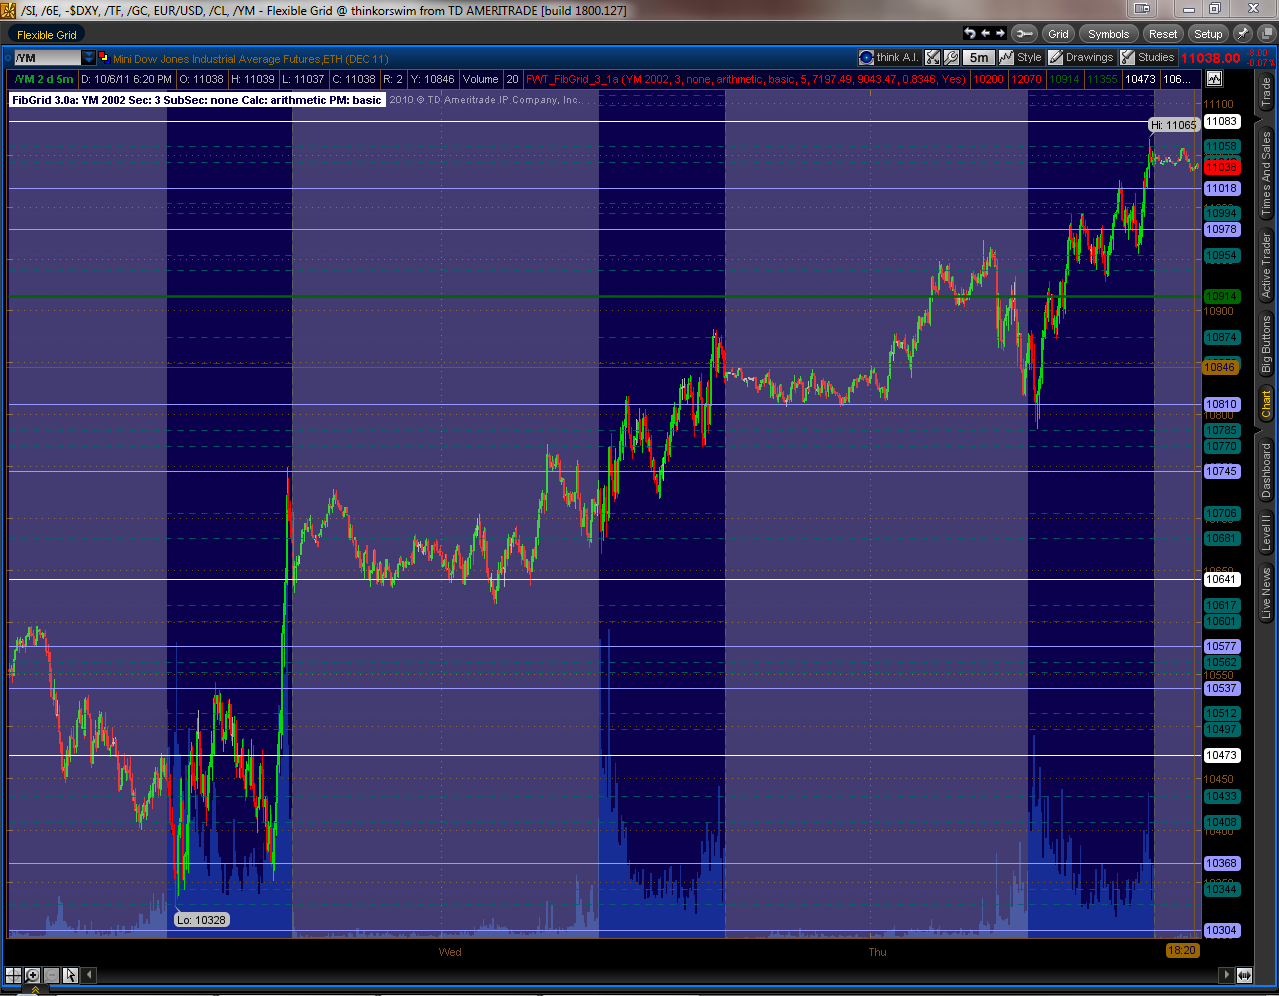
just to show you some recent charts with lines that never move that will always be there.. pretty amazing really, even for inter day trading.. you be the judge:
CL:
YM:
dont believe anything you hear and only half of what you see
I want to test something. It's simple. Place some random lines on your chart prior to the day opening, and see if at the end of the day you feel like those lines were important (try to imagine they weren't random, but some expensive or complicated …
If not, I suggest reading it and really what I suggest is reproducing my test yourself on a daily basis for a few days. The point is better understanding your perception and how the mind works, not that the numbers are at all useful in any way.
Using daily pivots are a bit different, because it is a self fulfilling prophecy. So you might put daily pivots side-by-side with your indicator and see if there is a difference.
I have been using levels from an outside vendor for 8 months. No fibs are involved so if you require fibs I would not suggest it. When certain parameters are violated the levels are automatically recalculated. They appear on your charts and update throughout the session. They might change as many as 3 times throughout a large range session. This is great for 24 hour markets. When the 6E makes a large move overnight you are not left in no mans land for the US session.
They appear on your NT charts and look and color are adjustable. They come with a simple yet powerful PDF that explains how to employ them. They are not simple S/R lines. They are the best I have ever used.
I have no hound in the hunt but if you want contact info for a free trial PM me.
Will try to attach a JING Screencast to show the level shift on 10/21 at 8:41 AM CDT
This post is a possible dupe as I tried to send it earlier.


 dont believe anything you hear and only half of what you see