Volume Profile is a way to plot
Volume By Price. This differs from a traditional plot type of Price By Time. Volume Profile shares a lot in common with Market Profile, but does not use
TPO (Time Price Opportunities) blocks. Time has little meaning in a Volume Profile chart.
Contents
|

|
|
|
Many of these terms have their own
wiki entry. Click the highlighted words to view their own entry.
- POC = Point of Control, the price where the most volume of the session traded
- VA = Value Area, the area in which 70% of the volume traded (VAH = Value Area High, VAL = Value Area Low)
- Composite = A composite profile is made up of long periods of data, usually from the last major swing
- Micro Composite = A short term composite profile, usually made up of only 2-3 days where the market was in balance
- CHVN = Composite High Volume Node, a peak in the composite profile distribution curve
- CLVN = Composite Low Volume Node, a valley in the composite profile distribution curve
- Balance = When a market is trading within its Value Area range
- Imbalance = When a market is trading outside its Value Area
- Naked = Means a key price level that has been extended forward until price returns to that level
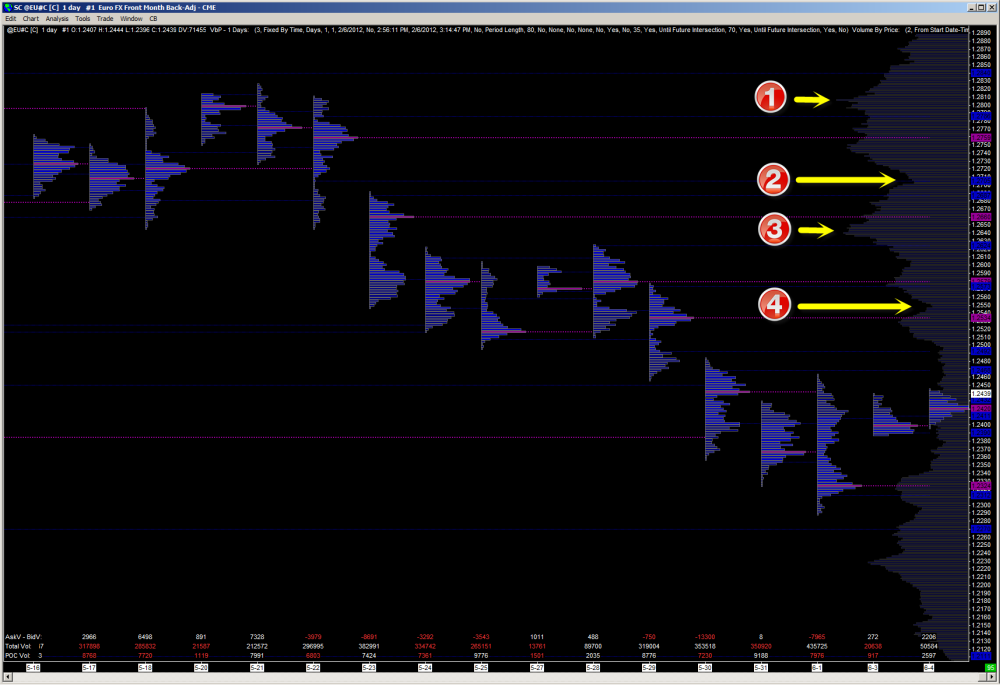
In the below example you will see a few composite high value nodes and composite low value nodes

(1) is a
CHVN, (2) is a
CLVN, (3) is a CHVN, (4) is a CLVN
[hide][top]Value Areas and S/R Example
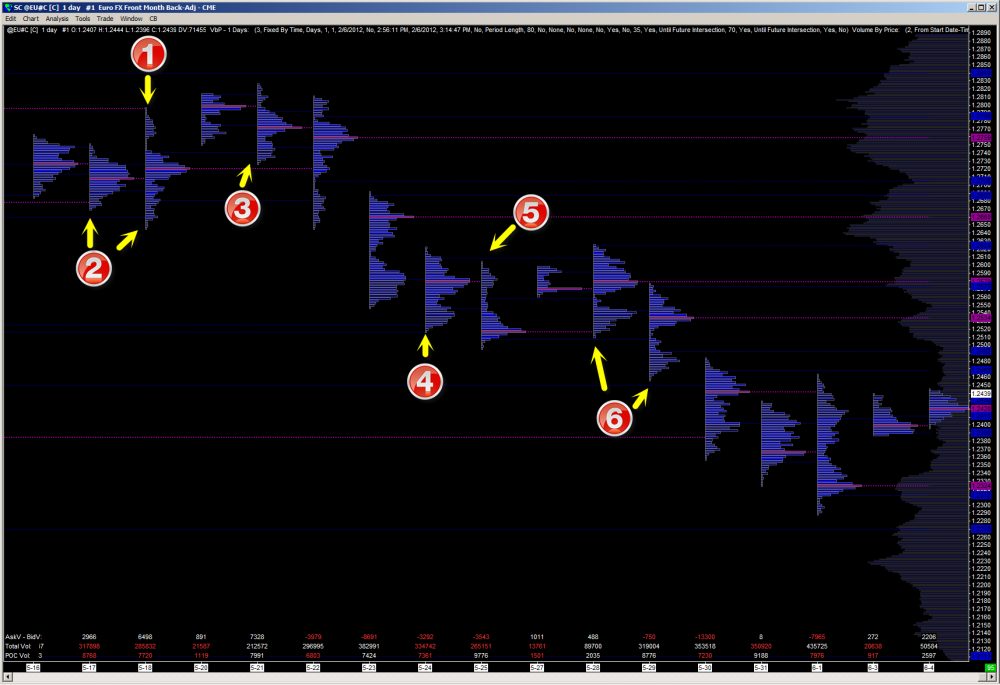
The below example demonstrates possible
support and resistance or "key areas" which were generated by Volume Profile

Here we see the
POC and VA's being extended and well respected. Some of these lines go back many months or years, and take note that this chart is 700 ticks top to bottom, so don't get freaked out that there are a lot of lines on the chart.
[hide][top]Point of Control Example
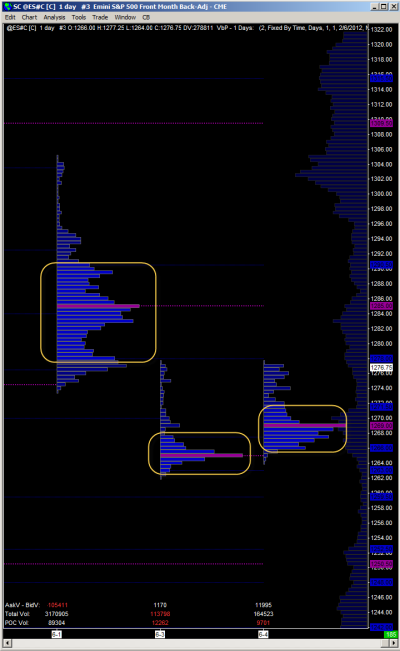
This example shows the POC more clearly (in magenta).

There are not currently any references cited in the article.
