NexusFi: Find Your Edge


Home Menu


If This Is Such a Strong Economy, Why Does This Chart Look Recessionary?


Discussion in Traders Hideout

Updated
    1. trending_up 1,269 views
    2. thumb_up 2 thanks given
    3. group 1 followers
    1. forum 1 posts
    2. attach_file 0 attachments


Search this Thread
  #1 (permalink)
 
kbit's Avatar
 kbit 
Aurora, Il USA
 
Experience: Advanced
Platform: TradeStation
Trading: futures
Posts: 5,854 since Nov 2010
Thanks Given: 3,296
Thanks Received: 3,350

Is the U.S. really a post-oil economy?

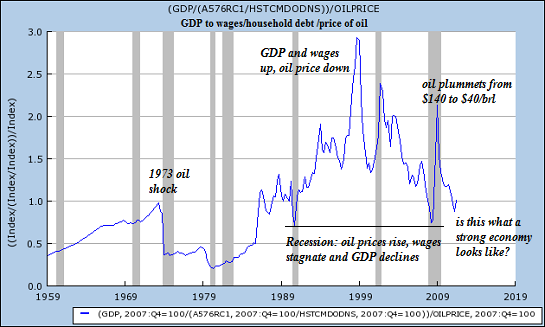
One way to gauge the real economy is to look at charts of the GDP, wages, household debt and the price of oil; another way is to correlate all of these on one chart. The following chart (courtesy of frequent contributor B.C.) plots these four metrics thusly: GDP/(wages/household debt)/price of oil.

What pops out of the chart is what happens when oil spikes higher or declines. In 1973, the first oil shock sent the economy off a cliff. Conversely, when oil fell to $12/barrel in the late 1990s while wages were rising strongly, the plotline peaked, reflecting a strong economy.

In 2008, oil spiked to $140/barrel in 2008, household debt reached record heights and wages began stagnating, and the economy fell into a sharp recession. When oil plummeted back to $40/barrel in early 2009, the plotline spiked up.
When oil prices and household debt are high while wages stagnate or decline, the economy sinks to recessionary levels.


Here are B.C.'s observations:
This chart utterly discredits the economics profession and those who claim that the post-industrial economy ("deindustrialization" and "financialization") is not oil-constrained and the service economy is what the rest of the world should adopt as the normative standard at $100+/barrel oil.
The current plotline is hovering just above the recessionary levels of late 2008. Does this reflect a strong economy, or one that is weak? If oil keeps climbing, what will that do to a visibly weak economy? The Bulls are convinced that the U.S. has decoupled from the rest of the world and from the price of oil. This chart makes the opposite case: the price of oil matters, especially when wages are declining and household debt is elevated.

charles hugh smith-Weblog and Essays


Started this thread Reply With Quote
Thanked by:

Can you help answer these questions
from other members on NexusFi?
Roland Garros Final Day: $3M on Zverev at 80.5% -- Leban …
Prediction Markets & Event Contracts
Iran Talks Final Stages -- Two VLCCs Exit Hormuz, Record …
Traders Hideout
Four New E-mini Futures Launch June 29 -- Russell 3000, …
Emini and Emicro Index
More Than Capable: Hegseths War Warning Validates $114M …
Prediction Markets & Event Contracts
Wood Mackenzie Drops $200 Oil Forecast -- Airspace Expir …
Prediction Markets & Event Contracts
 
Best Threads (Most Thanked)
in the last 7 days on NexusFi
NexusFi site changelog and issues/problem reporting
16 thanks
Darmok and Jalad at Tanagra
3 thanks
Big Mike in Ecuador
1 thanks
30 Sessions
1 thanks
  #2 (permalink)
 
Private Banker's Avatar
 Private Banker 
La Jolla, CA
 
Experience: Master
Platform: Sierra Chart, X_Trader Pro, OptionsCity
Broker: Advantage, Trading Technologies, OptionsCity, IQ Feed
Trading: CL, NG
Posts: 1,038 since Jul 2010
Thanks Given: 1,713
Thanks Received: 3,864

This is a good tool of reference. The so called economic recovery is nothing more than a result of central banks around the world constantly figuring out ways to inject liquidity into the system. If the Fed hadn't stepped in back in 2009, where do you think equities would be now? It'd probably be pretty ugly. Speaking of equities, this entire rally wreaks of central bank intervention. Whether it be the ECB's LTRO or the Fed's continued although not talked about much POMO. Equities are now an official central planning tool and appear to be in another bubble. For pure entertainment, I keep an eye on ES every day as it limps higher and higher with it's 5 -7 point daily range and it's endless bid. Sure, you can make a case for fundamental and technical reasons for it but a market with no pullbacks to speak of is getting juiced by something/someone. Sure there's micro retracements but as soon as there's a 10 handle, the BTFD'ippers step in with two hands and their freshly printed Bernank bucks.

The sad thing is what the central banks have now done is created a situation that will constantly require interventions because crises will continue to develop when all of this run up is artificial demand/AAPL. Couple that with the HFT's churning equities all day long higher and we've got a real comedy show. Then there's the current IPO scam's that are coming out. Case in point, Yelp's IPO today. Absolutely hilarious! The trick is, they float a whopping 10% - 12% to create a "high demand" while the current shareholders just have to sit back and watch their shares rip through the roof. "Fakebook" is about to do the same thing.

But hey, I'm doin alright.... Lol! Wasn't that an Andrew Dice Clay saying? Anyway, this will be very interesting to watch pan out as I don't think it will end well.

Cheers,
PB


Reply With Quote
Thanked by:


Last Updated on March 2, 2012


© 2026 NexusFi®, s.a., All Rights Reserved.
Av Ricardo J. Alfaro, Century Tower, Panama City, Panama, Ph: +507 833-9432 (Panama and Intl), +1 888-312-3001 (USA and Canada)
All information is for educational use only and is not investment advice. There is a substantial risk of loss in trading commodity futures, stocks, options and foreign exchange products. Past performance is not indicative of future results.
About Us - Contact Us - Site Rules, Acceptable Use, and Terms and Conditions - Downloads - Top
no new posts