Welcome to NexusFi: the best trading community on the planet, with over 150,000 members Sign Up Now for Free
Genuine reviews from real traders, not fake reviews from stealth vendors
Quality education from leading professional traders
We are a friendly, helpful, and positive community
We do not tolerate rude behavior, trolling, or vendors advertising in posts
We are here to help, just let us know what you need
You'll need to register in order to view the content of the threads and start contributing to our community. It's free for basic access, or support us by becoming an Elite Member -- see if you qualify for a discount below.
-- Big Mike, Site Administrator
(If you already have an account, login at the top of the page)
Hi chris.. thank you for your contribution.... I am thinking moving away from ninja soon, but im am hooked to Gom volume ladder, specially the COT that displays on the top and bottom of the bar.... I don't know anything about programming, but do you think it would be possible to import that to sierra charts(the COT). Also, is there a Vwap study on sierra charts.
If i can use my indicators on sierra, ill move in a flash. I constantly have problems with it. Im just addicted to the Gom indicators.
Thanks
yes on wvap, since SC already stores b/a data all you have to do is supplying them with the COT calculation and ask them to program it in, depending on the work complexity they will ask for a fee most of time 50 bucks or less.
is the vwap indicator native to the application, or do i have to buy it. Is it possible for you to upload the file if its not?
Thanks
btw, who do i supply the COT information to?
all charts and indicators here and in the other SC thread are done without extra programming, they are all included. If you invest some work, you get pretty close to MD with the volume/delta stuff. And as cory mentioned, no hassle with historical bid/ask data. You only need to purchase SC package No.5. And because you can do it on a monthly basis after the test, there is no risk. I never look back to NT.
- just post the COT calculation at support forum asking admin to program it and how much it costs. If it looks interesting enough somebody will do it for free.
Hello,
This is my first post, I use volume analisys for trading on NT with Gom indicators.
This thread pushed me to try SC cos of the pros. of backfill it provides, and the low cost.
So I compared the 2 platform, NT with Zen-Fire as data feed and SC with OEC data feed and SC historical backfill. I found differences and discrepancies in the calculation of delta bars and in the footprint chart too.
I compared GomCD with VolumeBreakdown on Market Delta, and they are the same, so I assume that GomCD calculation is correct, and I compare the Zen-Fire volume at price with that provides from CME and the are the same, so I assume that Zen-Fire provides the right volume data, and may the bid ask quote too.
Don't know if delta bars calculation on SC is correct and may the OEC data and/or SC backfill are not correct.
Now to understand if SC works good and if Zen-Fire provides the rigth data should be using both with the same datafeed like DTN iqfeed as Fulcumtrader and othors told that are the best and may the only reliable.
However, as simplicity of use and, as analysis and graphical view, NT is much higher.
Lubo.
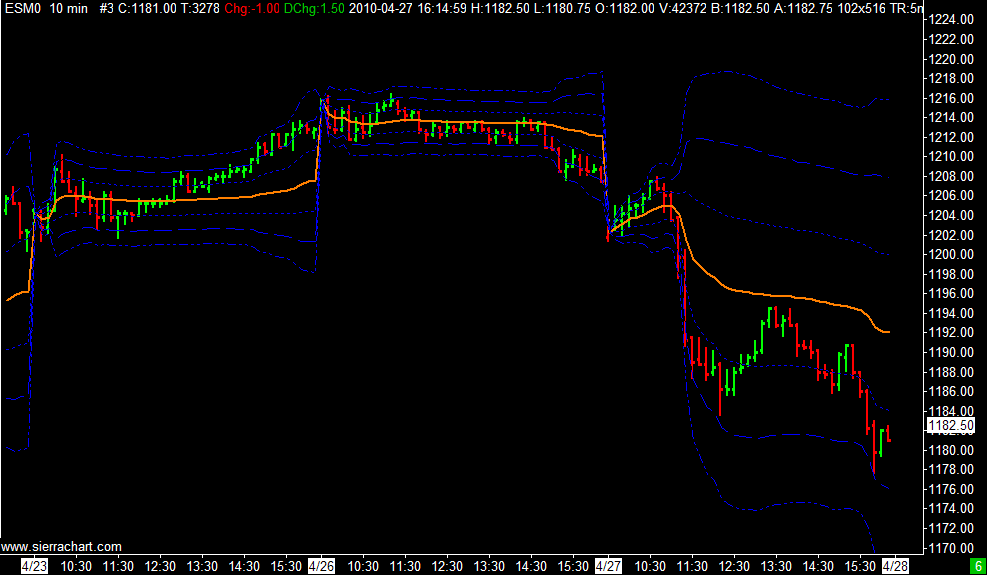
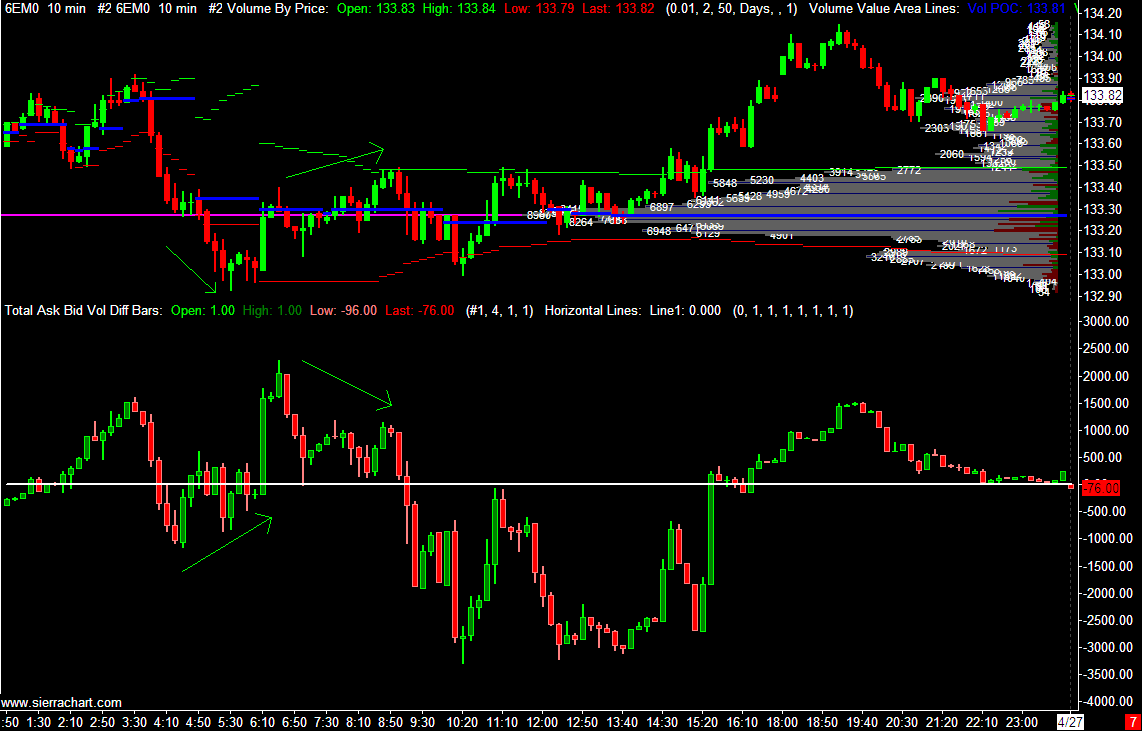
I attach some charts of 6E of monday 26 April, my Time zone is GMT + 1 (now GTM+2 cos light saving), if FulcumTrader could provide the same chart with Investor RT and DTN we can try to compare the different chart and data feed.
Thanks.
Luke.
No it's the same, download my picture and u will see that the delta bars are the same, I think the difference from 0 line is caused by the different TimeZone.