NexusFi: Find Your Edge


Home Menu


looking for macd with support and resistance range


Discussion in NinjaTrader

Updated
    1. trending_up 1,476 views
    2. thumb_up 2 thanks given
    3. group 2 followers
    1. forum 2 posts
    2. attach_file 2 attachments


Search this Thread
  #1 (permalink)
 profound 
toronto
 
Experience: Intermediate
Platform: ninjatrader
Trading: futures
Posts: 1 since May 2015
Thanks Given: 0
Thanks Received: 0

I'm looking for macdbblines that look similar or exactly like the following attachment


Started this thread Reply With Quote

 
Best Threads (Most Thanked)
in the last 7 days on NexusFi
Sober Journey With S&P
24 thanks
2026 Jlab journal
10 thanks
Trying to learn Volume and price action correlation
7 thanks
Lady Vols Primer: Trading Volatility Journal
6 thanks
Algo automated / semi-automated trading anyone?
6 thanks
  #2 (permalink)
 
Big Mike's Avatar
 Big Mike 
Manta, Ecuador
Site Administrator
Developer
Swing Trader
 
Experience: Advanced
Platform: Custom solution
Broker: IBKR
Trading: Stocks & Futures
Frequency: Every few days
Duration: Weeks
Posts: 50,669 since Jun 2009
Thanks Given: 33,669
Thanks Received: 102,557

Try the main thread


Mike


We're here to help: just ask the community or contact our Help Desk

Quick Links: Change your Username or Register as a Vendor
Searching for trading reviews? Review this list
Lifetime Elite Membership: Sign-up for only $149 USD
Exclusive money saving offers from our Site Sponsors: Browse Offers
Report problems with the site: Using the NexusFi changelog thread
Follow me on X Visit my NexusFi Trade Journal Reply With Quote
  #3 (permalink)
 
Fat Tails's Avatar
 Fat Tails 
Berlin, Europe
Market Wizard
 
Experience: Advanced
Platform: NinjaTrader
Broker: Interactive Brokers
Trading: Futures & Stocks
Posts: 9,887 since Mar 2010
Thanks Given: 4,242
Thanks Received: 27,114


RSI, Stochastics, TSI are normalized indicators and you can easily draw support & resistance on the indicator panel.

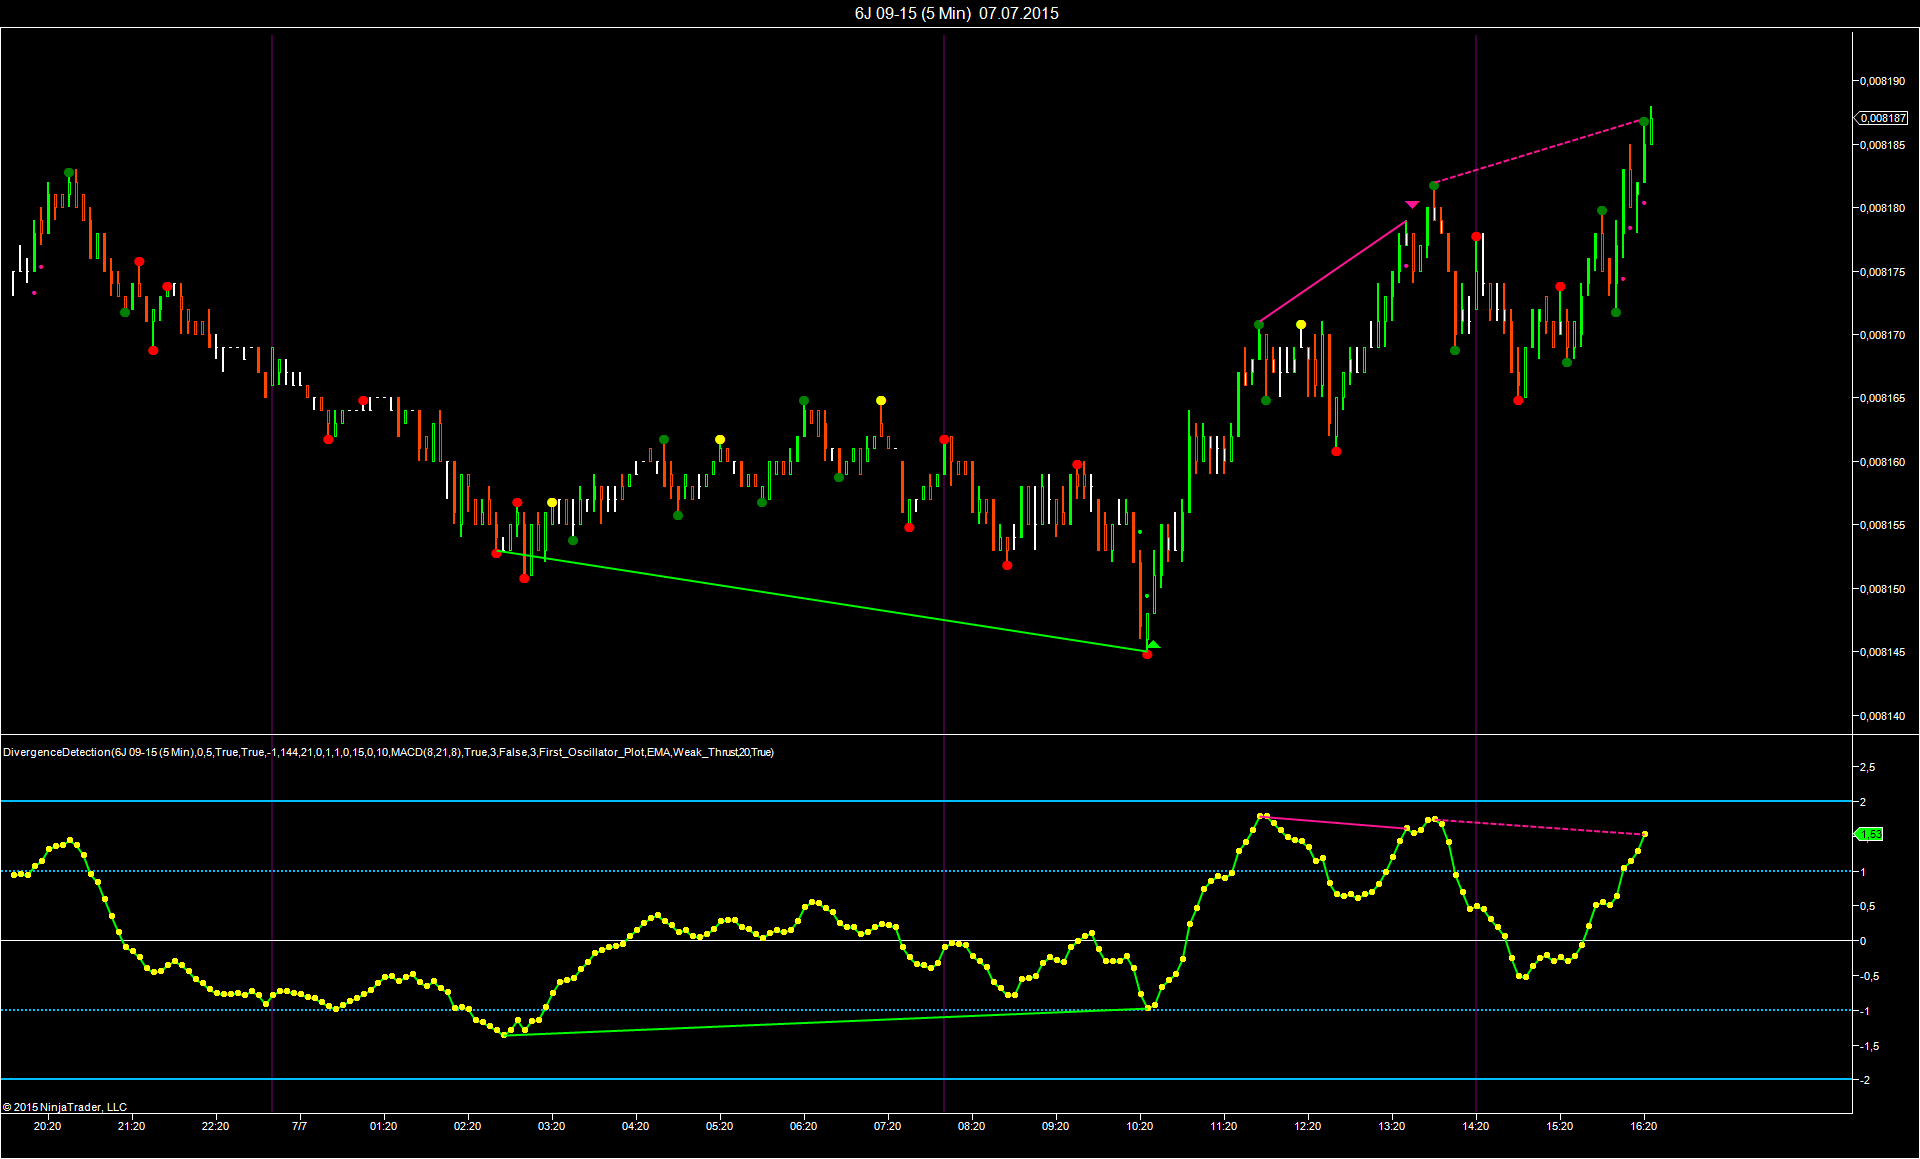
However, the MACD requires normalization before you can use it with support & resistance.

A simple way of normalizing indicators is obtained by calculating the z-score.

The chart below shows the z-score of a MACD with S/R lines (1st and 2nd standard deviation) added.

In this case the normalized MACD is used for detecting divergences.


Reply With Quote
Thanked by:


Last Updated on July 7, 2015


© 2026 NexusFi®, s.a., All Rights Reserved.
Av Ricardo J. Alfaro, Century Tower, Panama City, Panama, Ph: +507 833-9432 (Panama and Intl), +1 888-312-3001 (USA and Canada)
All information is for educational use only and is not investment advice. There is a substantial risk of loss in trading commodity futures, stocks, options and foreign exchange products. Past performance is not indicative of future results.
About Us - Contact Us - Site Rules, Acceptable Use, and Terms and Conditions - Downloads - Top
no new posts