Welcome to NexusFi: the best trading community on the planet, with over 150,000 members Sign Up Now for Free
Genuine reviews from real traders, not fake reviews from stealth vendors
Quality education from leading professional traders
We are a friendly, helpful, and positive community
We do not tolerate rude behavior, trolling, or vendors advertising in posts
We are here to help, just let us know what you need
You'll need to register in order to view the content of the threads and start contributing to our community. It's free for basic access, or support us by becoming an Elite Member -- see if you qualify for a discount below.
-- Big Mike, Site Administrator
(If you already have an account, login at the top of the page)
Good discussion! We plan to craft a response to several of the discussion points soon. In the meantime, a few points. Bookmap is simply a platform that very objectively displays and visualizes market data in a unique way. Bookmap is not an indicator, setup, nor trading strategy.
There are insights and advantages that can be drawn from the way the market data is visualized. For example, you may consider watching a recent Futures.IO webinar just a few weeks ago with professional trader Scott Pulcini. He is an order flow expert trading stocks and futures on both higher and lower time frames.
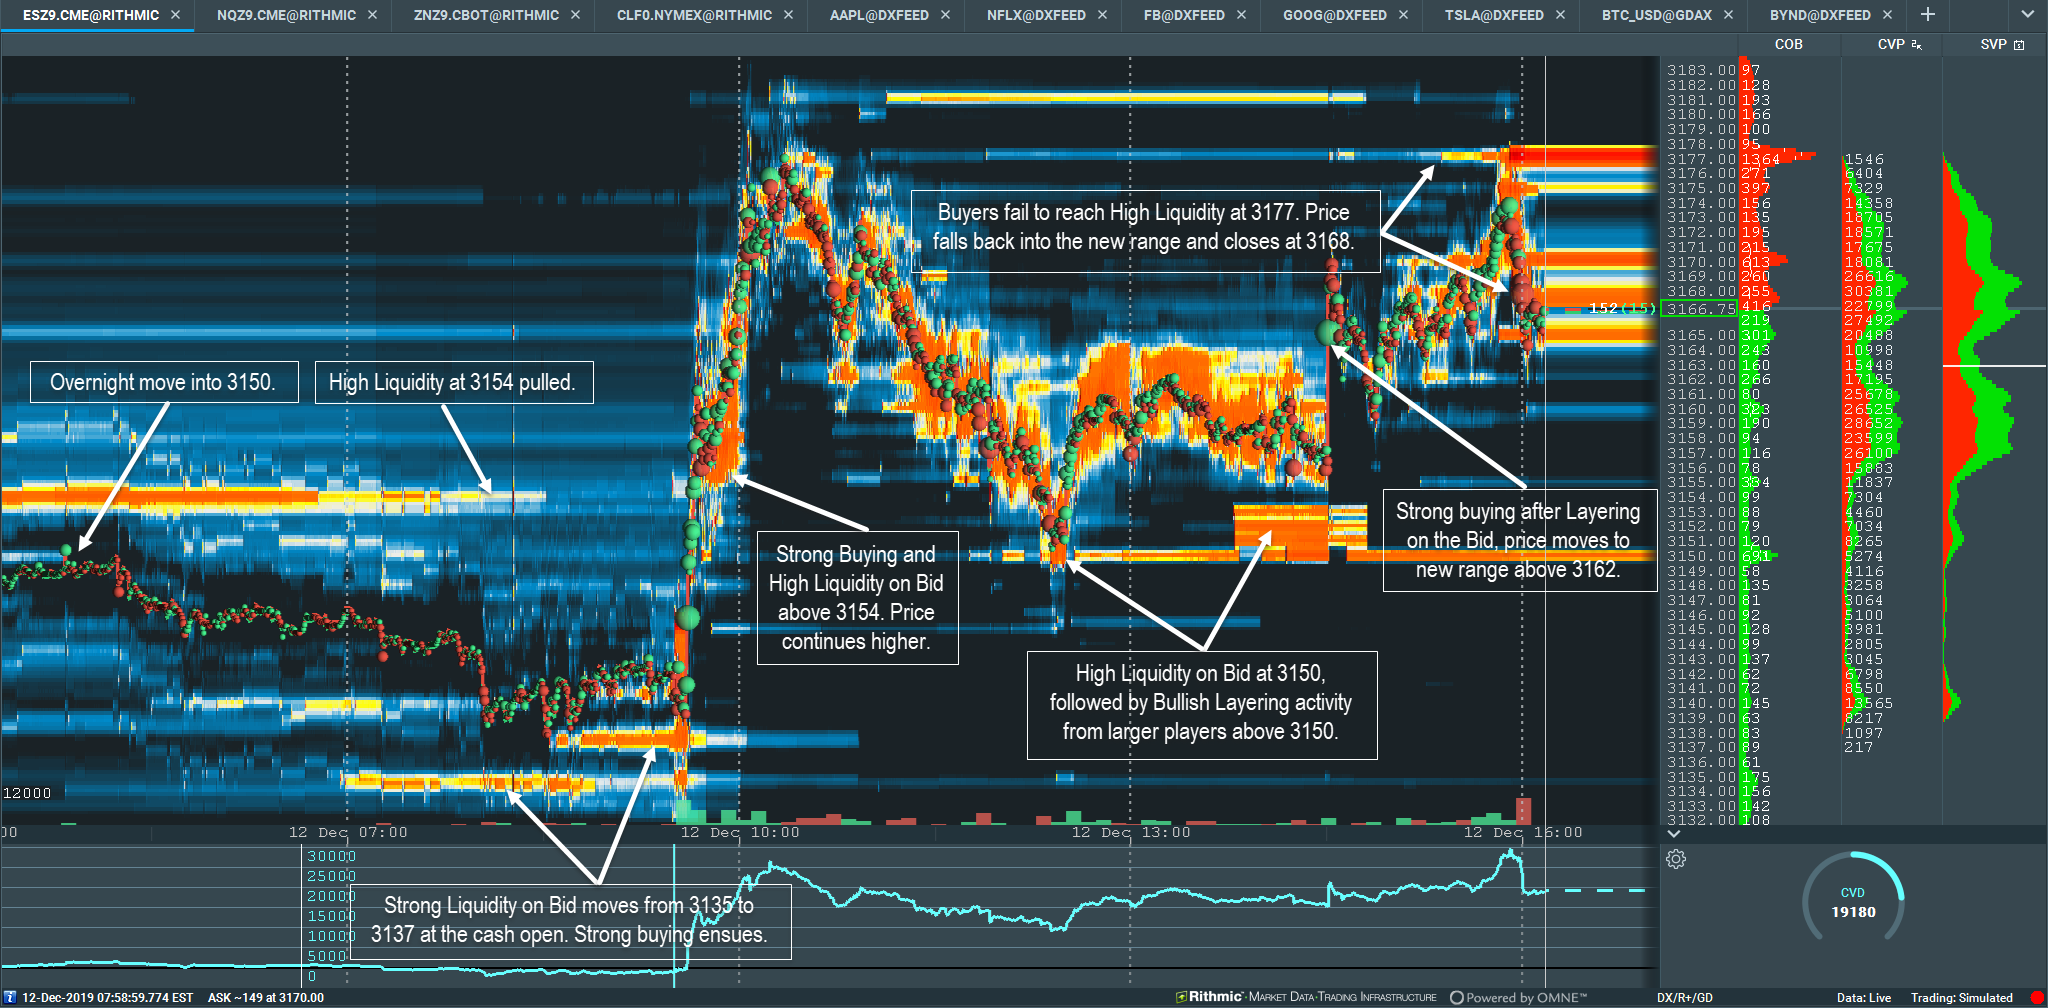
Nice liquidity activity captured by the heatmap today in the ES. Especially note the larger player(s) heavily layering in on the bid around 3150-3153 at 2:00-2:30 pm ET. Strong aggressive buyer ensued and moved price to a new range. Some pretty nice examples of the context and relationship between price structure, liquidity, and aggressor volume throughout the entire day.
You did post a nice description but as it is easy at the end of the session, i was wondering... i took the pullback at the 24h VWAP (3159) and lost a few points there no big deal but what cues could i have read that the VWAP level would not hold if i were using your tool?
Your VWAP idea looks good, there is a pause or consolidation at 3160 around 9:45 ET before the next leg higher. The pullback in this case went deeper, even through the earlier Bid activity at 3154, to test the 3150 structure from the overnight session. There was high liquidity at 3150 resting there as well. This was the low of the pullback.
Look for the liquidity levels to hold and significant buyers to move price the opposite direction. This is where Bookmap can help, instead of simply taking trades off of a VWAP, Fib level, or whatever. The Layering by larger players at 3150-3153 around 2:00-2:30 pm ET is another really big help. Aggressive buyers come in and really move price away quickly. You may consider jumping in with a market buy order or look for a pullback to the top of the structure at 3160 as well.
We go over in detail this kind of order flow analysis in our Bookmap Advanced Education webinars everyday at 11-12 ET. It's free to the public on Fridays if you want a peek into the process. The education is not hindsight, we objectively analyze the current market volume and liquidity and give insight to future price movements.
Note it is not a trading room, it is about reading the order flow. For more education, including trading rooms, consider contacting several of our Bookmap educator partners.
Attached the pertinent log files associated with the crashes. You'll find the Logs located in the folder in C:\Bookmap\Logs.
If we cannot assess the issue from the log files, we'd like to remote into your machine directly to find the issue and solve it.
Just a note, Bookmap 7.0 has been a solid product with minimal problems for our users. Nonetheless, it is still a Beta version. Look forward to your email and solving your issue.
Thanks jz166, the updated version of Bookmap that support recommended you install should solve your issues. We closed the ticket for now. If you continue to experience issues, simply let us know by replying again to the support ticket. Happy Holidays.