Welcome to NexusFi: the best trading community on the planet, with over 200,000 members Sign Up Now for Free
Genuine reviews from real traders, not fake reviews from stealth vendors
Quality education from leading professional traders
We are a friendly, helpful, and positive community
We do not tolerate rude behavior, trolling, or vendors advertising in posts
We are here to help, just let us know what you need
You'll need to register in order to view the content of the threads and start contributing to our community. It's free for basic access, or support us by becoming an Elite Member -- discounts are available after registering.
-- Big Mike, Site Administrator
(If you already have an account, login at the top of the page)
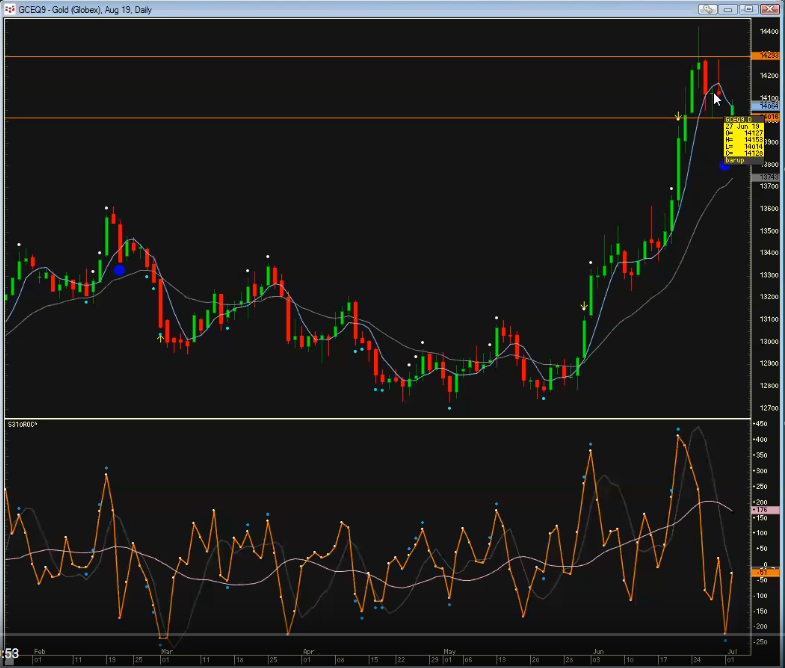
Taking some time to study Linda Raschke and started watching her video "Tradesheet Explained" ().
Around the 5 minute mark she mentions that Tradestation has some issues with plotting the correct closing prices and said a workaround was to use the 1440min timeframe instead of the daily.
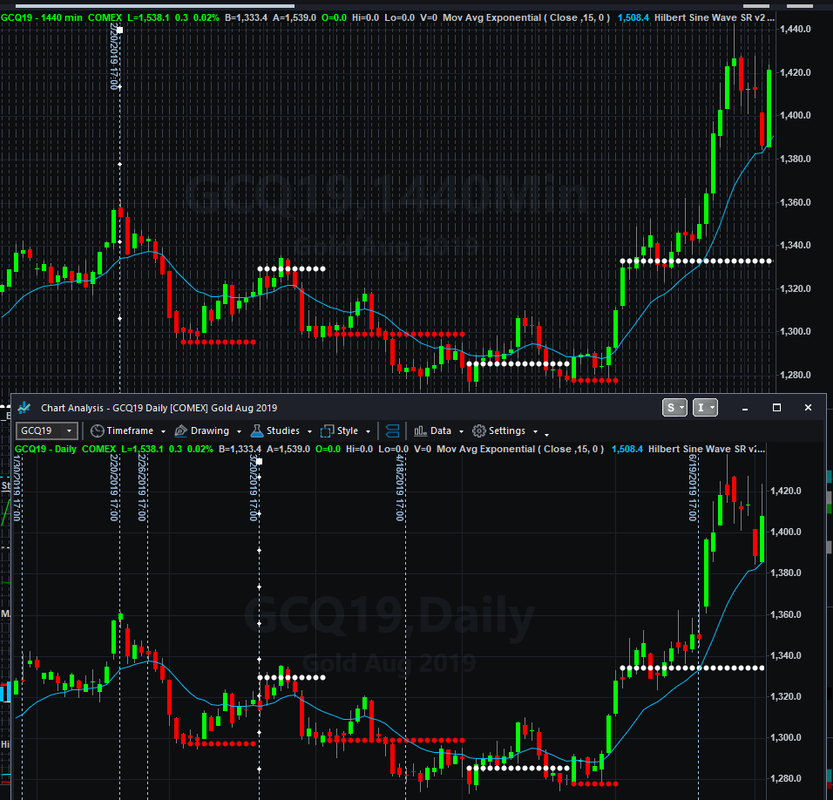
Going into minute 6 of the video she shows a daily chart of Gold (GCQ19) and I noticed that some of her data is indeed different than mine when on the daily timeframe in Tradestation. When I switch to the 1440min it's nearly identical as hers.
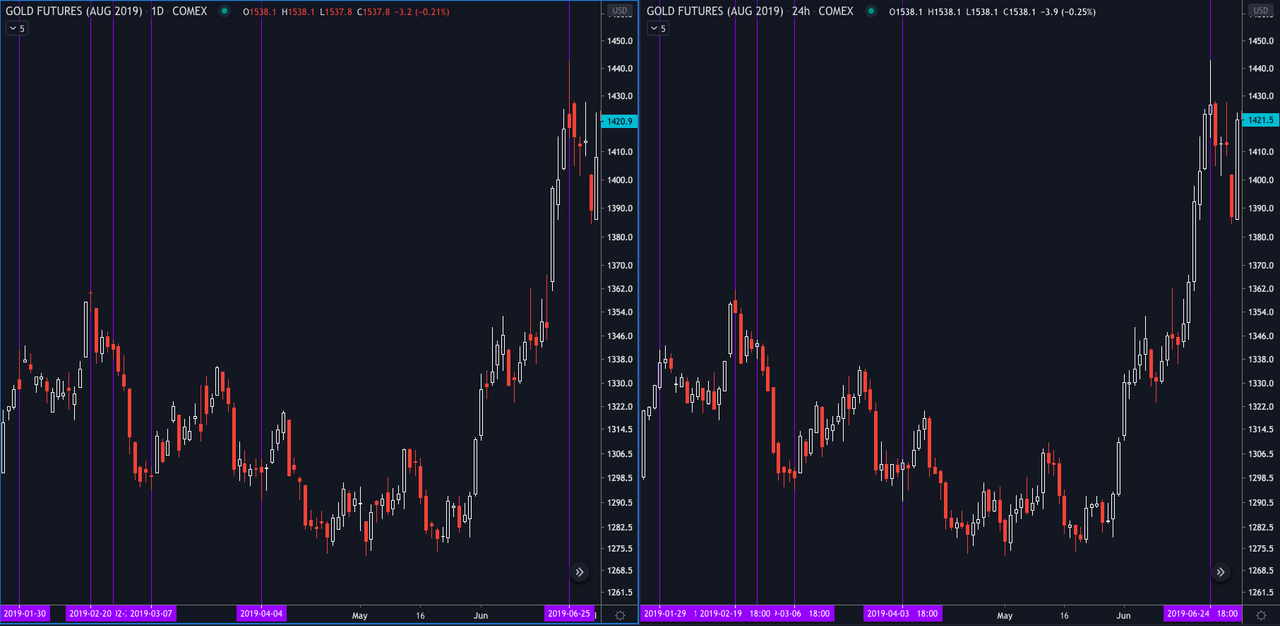
I was curious so I did the same thing but on TradingView and the results were the same (daily different than 24hr). When I put 1440min in TV it automatically put 24hr.
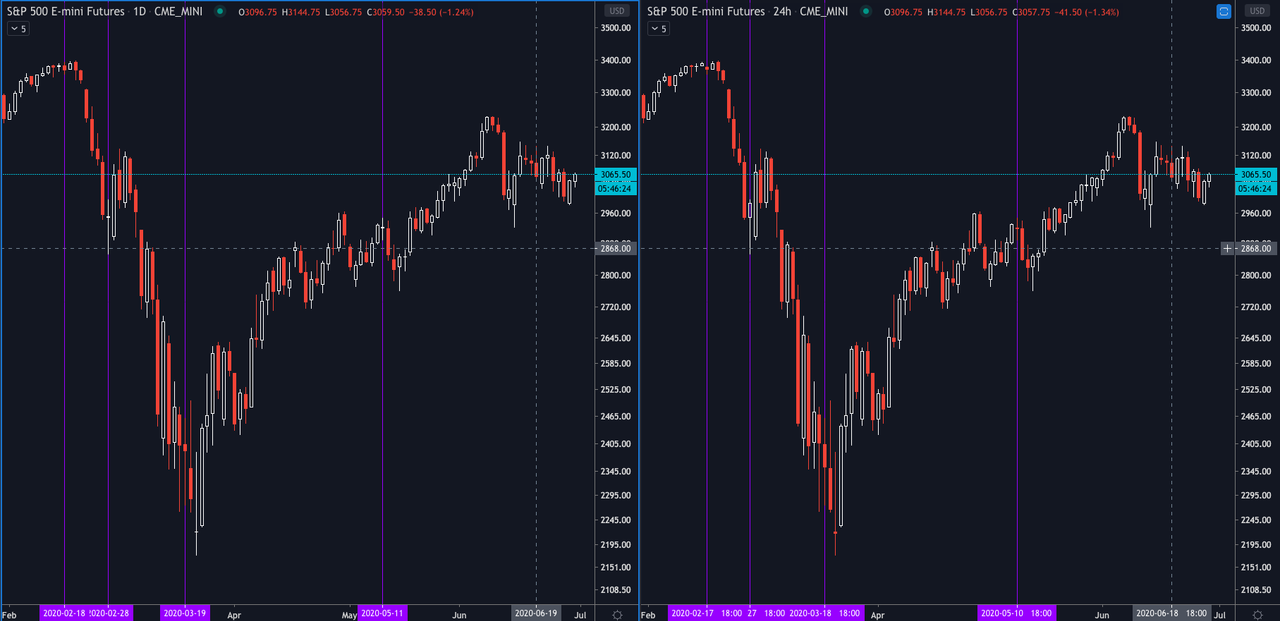
I then look at the @ES and notice some differences as well! For example, on the daily chart, yesterdays close was 3047.75, while on the 24hr chart the close was 3046.00.
In over a year of me learning the markets, I never even thought about this. I assumed the close on the daily was the same no matter what.
Any suggestions on how to approach this? I'm basically looking for the correct daily close, high, and lows for the Emini indicies and the rest of futures (@US, Gold, Wheat, Soybean, etc). Never thought I'd be stumped on something so trivial!
First screenshot is from Linda's video around the 6min mark. Second screenshot is my comparison of the same chart on Tradestation. Third screenshot is the same chart but on TradingView. Last screenshot is of the ES on TradingView showing some differences.
Thanks in advance!
Can you help answer these questions from other members on NexusFi?
For equity indexes like ES, don't sweat it. These closes are all generally pretty close anyway (all times in the post are Eastern):
* the cash close -- this is at 16:00 ET
* the settlement price -- as ninjus mentions, the daily bar is showing you the settlement price. For ES, this is the VWAP of trades from 16:14:30 to 16:15 and is published by CME. Other products have a similar procedure, at different times.
* the last trade is the 46 you saw, and is the last trade before the close of trading at 17:00
FWIW, I don't care at all about the settlement. ES is a derivative of an index of 500 stocks, and those stocks all have daily closes at 16:00. They are closed for trading 4 hours later at 20:00, but the close most people care about is the 16:00 cash close. So, the last trade before the cash close at 16:00 in ES is far more important to me than the settlement price. Remember that SPY has no "settlement" and its daily 16:00 close is likely watched by far more people than ES. Also, IMO, the last trade at 17:00 means very little to anyone.
Now, for commodities like you mention, I'd personally use the settlement price as the close (3pm for gold, 2:30pm for crude, wheat, etc.), as you're trading pretty darn close to the real thing (you're not trading spot oil, but the price for spot oil is not centralized anyway).
Since markets have gone mostly 24 hours in the past couple of decades, the "close" is less meaningful than it once was anyway. But I think the above guidelines are still pretty good ones. Happy trading!
The bigger question is, what role does the close play? Does it matter? Once you answer that question, then which one to use, under what circumstances, should reveal itself very clearly. IOW, the reason to use the close should dictate what to use, not the other way around. People place a lot of significance on data points without understanding why, or thinking it through. If you think about why you'd want to use the close, you may reach the conclusion that it's just not that important. Or, that it's really important. But the key is, you come up with that, and that's the process that helps you improve.
Thanks for starting this discussion @slythic! It's something that I probably should have done a while ago as it's a topic that I obsessed over for a non-insignificant amount of time. .
I trade gold exclusively just about every morning. I have found there isn't a right or wrong chart to look at really. I have gone long periods when I have only looked at the 24 hour chart, and I have gone long periods when I have only looked at a 1440m chart. I have even traded a chart that displayed the OHLC and opening ranges for the Asian, Europe, and US sessions. I trade the early US session, and have seen that sometimes there is interesting price-action interplay between the 3 sessions. But for now I only watch the 24h chart briefly as my session begins, and then I watch the 1440m chart mainly. I have found the OHLC for both charts become relevant, as the p/a does tend to wiggle in these areas. I have no idea about the how/why of the matter though. . But it works for what I do. As the great @bobwest says, your mileage may vary. (Sorry BW!)
I think the previous post by @josh, is a pretty sound way of looking at it though...


 .
.  . But it works for what I do. As the great @