|
Tuen Mun
Posts: 2 since Mar 2021
Thanks Given: 0
Thanks Received: 0
|
I have subscribed Interactive Brokers' Level II data, and applying it the Multicharts. I inserted 3 instructments of same security into the same chart, i.e.
1. "1 tick" resolution with Quote Filed as "Trade" on same security (Green Dot)
2. "1 tick" resolution with Quote Filed as "Bid" on same security (Blue Colour)
23 "1 tick" resolution with Quote Filed as "Ask" on same security (Red Colour)
***Question:
1. It appears to me that the Bid/Ask never crossed prior 9:31:10, why there are "Trades" occur whereas bid/ask never crossed with each other as appeared in the graph...?
2. In order to investigate the issue, I exported the Bid/Ask tick data from QuoteManager, but the "Volume" column is always "0". I wonder is that IB's data deficiency or Multicharts fail to receive the Bid/Ask volume data...?
3. My Algo is trading on the Bid/Ask data, is there any pre-built indicator/Signal that can show the current best bid/best ask vs time on the chart..?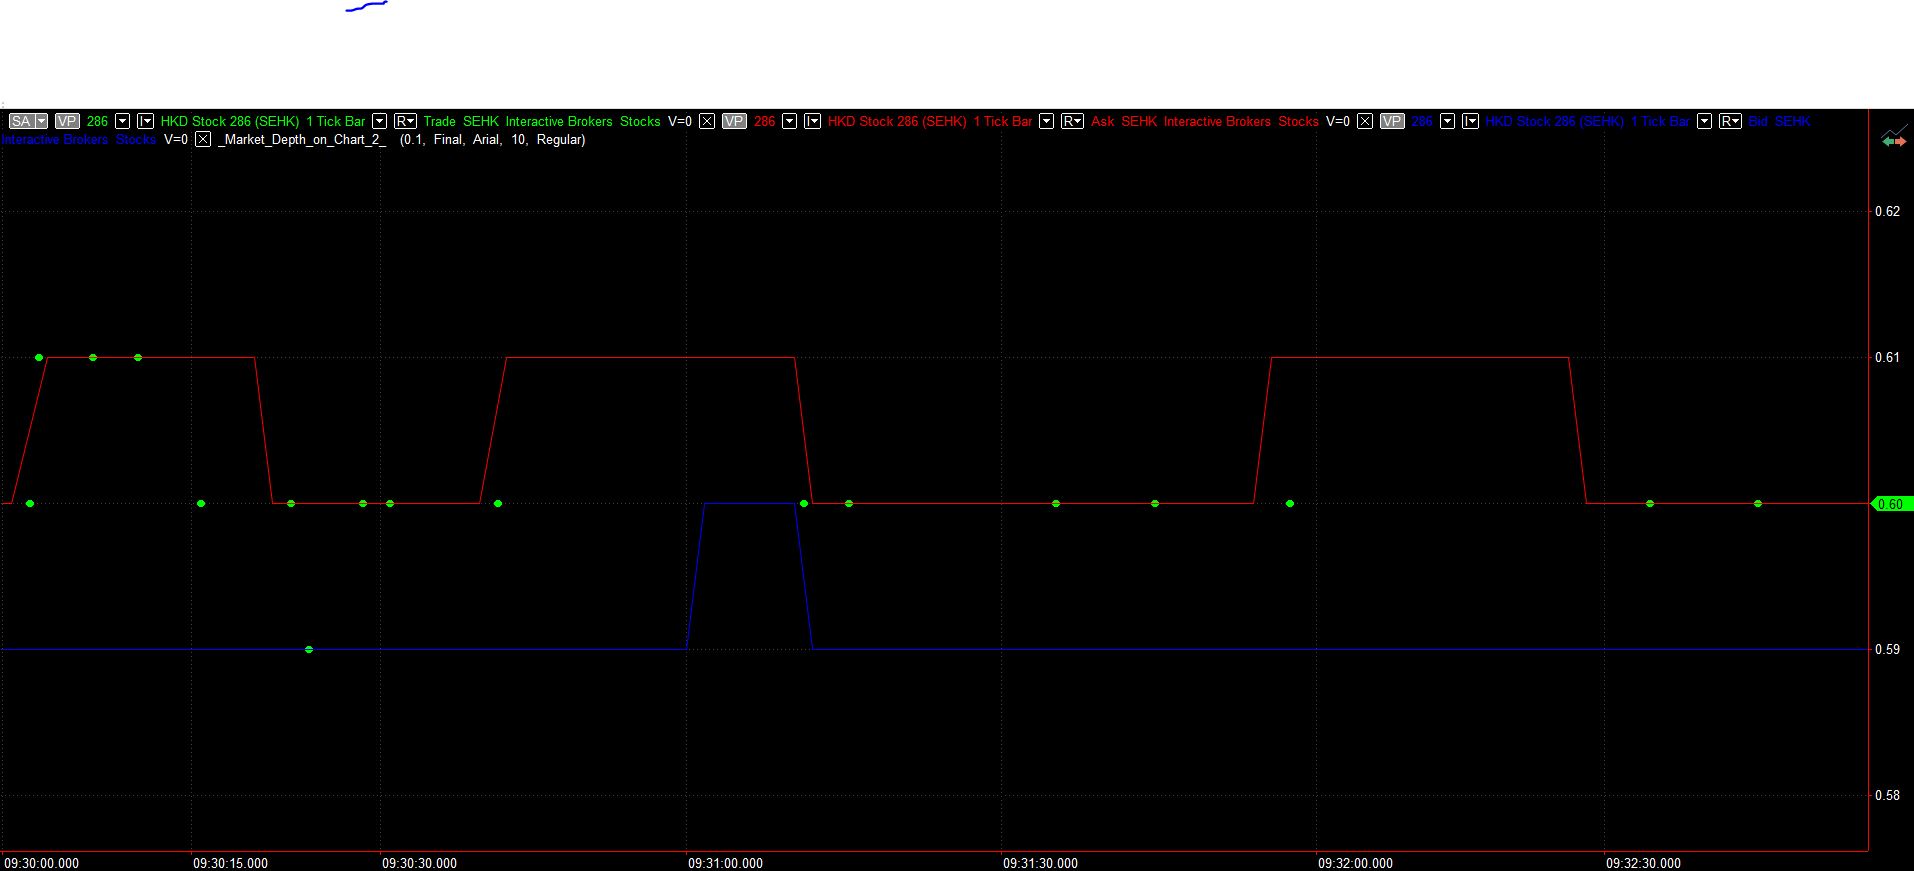
|


