Welcome to NexusFi: the best trading community on the planet, with over 150,000 members Sign Up Now for Free
Genuine reviews from real traders, not fake reviews from stealth vendors
Quality education from leading professional traders
We are a friendly, helpful, and positive community
We do not tolerate rude behavior, trolling, or vendors advertising in posts
We are here to help, just let us know what you need
You'll need to register in order to view the content of the threads and start contributing to our community. It's free for basic access, or support us by becoming an Elite Member -- see if you qualify for a discount below.
-- Big Mike, Site Administrator
(If you already have an account, login at the top of the page)
Some corrections: I think CME will charge you pro only if connecting more than 2 log-in concurrently. But still you will be paying another data fee for the other session.
Best solution is to download R/Trader Pro (Windows ONLY) and use the program to feed data to how many platforms you have. Then it will still count as 1 log in.
Just to be clear, Bookmap's Stop&Iceberg Tracker is sold separately on the Bookmap Marketplace and is not included in Bookmap 7.1 Global or Global+ versions, however it will work with either Bookmap version. The Stop&Icberg Tracker requires a Rithmic data connection and only works with CME Group instruments in the CME, CBOT, COMEX, and NYMEX. The indicator displays Native Iceberg and Stop order transactions.
There are many traders using it who have found it very valuable. For example, professional trader Scott Pulcini is currently basing his entire trading plan on Bookmap's Stop&Iceberg Tracker. There are several resources on our website and marketplace for more information, or you can always reach out to [email protected].
"I stare at bookmap every day for a few months now
Unfortunately I found this kind of scenario absolutely random. Sometimes price hit area of high liquidity and bounce. Other time it hits it and trades through. Other times it reverses just before reaching the level of high liquidity. Sometimes it hits more than one levels of high liquidity and continue. Complete randomness
Same for icebergs. I've seen veeeeery large icebergs and the price went through. Sometimes it continues. Sometimes it reverses after a few ticks. Sometimes it bounces from iceberg and never returns. Random outcome, random direction after iceberg hits
One thing I can confirm that generally levels of high liquidity are like a magnet. But those magnets are both on the bid side and on the ask size. Sooner or later price will hit them, but again it seems do be done in semi-random order
After months of watching this stuff I'm only getting more into conclusion that at the end of the day only price action matters
Do we have some heatmap users that found their edge only by looking into heatmap? Please correct me if my above statements are wrong."
We're happy to address this question; it is erroneous to assume if price hits an area of high liquidity it will bounce. Same for Iceberg transactions -- just because there are icebergs, even large ones, doesnt mean price will bounce. There can simply be more aggressive sellers than liquidity or icebergs, and price will cut right through those areas. Other times there are less aggressive sellers, and the liquidity and icebergs absorb all the aggressive selling and price bounces.
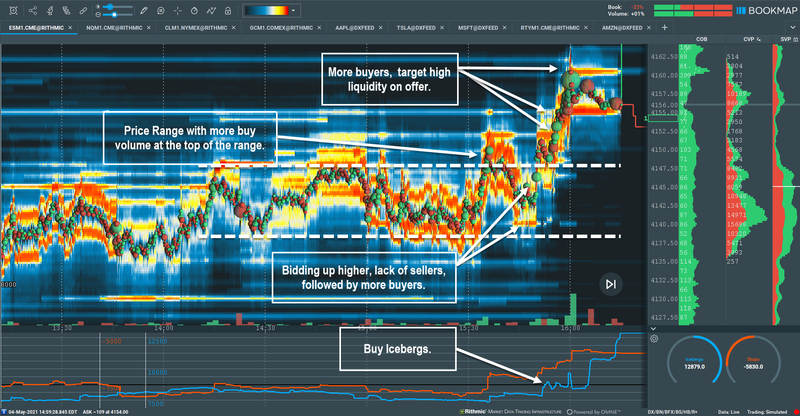
Therefore, its the context between the price structure, aggressor volume (market buy/sell orders), and liquidity (limit buy/sell orders) that really matters. Comprehending this context can allow for heightened insights to where price may move next. For example, suppose price is in a random walk within a consolidated range and there is high liquidity above and below the range. However, at the highs of the range, you notice more buyers, yet price drops back down into the middle of the range. However, the liquidity on the bid moves up from the bottom of the range. Price doesnt test the liquidity because there are not many aggressive sellers hitting the bid. Moreover, you note there are some iceberg transactions just in front of the bid liquidity. Aggressive buyers begin entering the market and price breaks out of the range and charges up toward higher liquidity on the offer, like a magnet. Understanding the context of the aggressive volume and the liquidity within the price range outlines a skew in the auction and the higher potential for the ensuing breakout. This can help you make more informed trading decisions. Attached is an image of price action in todays ES that illustrates the point.
Bookmaps educational course and Daily Live Advanced Webinars cover this type of material everyday. It is forward looking live analysis, not hindsight, and includes live trading. Please log into bookmap.com/portal to access these materials. Note, a subscription to Global+ is required for the Advanced webinars.
There is not trial with Bookmap. Instead we offer a free version that connects to one cyrpto currency for free, and that data is free too. There is also a delayed data feed for stocks and Futures. This free version gives you a good overview of Bookmap. If you want live data for stocks and/or futures, or you want to access more than one crypto currency, then a subscription to Bookmap Global or Global+ is required. Note, you will need to provide the data; it is not included in the subscription fee. Go to bookmap.com and visited the Connectivity and Pricing sections and click on the Connectivity Guide and the link below Pricing section for more details on pricing comparisons.