Welcome to NexusFi: the best trading community on the planet, with over 150,000 members Sign Up Now for Free
Genuine reviews from real traders, not fake reviews from stealth vendors
Quality education from leading professional traders
We are a friendly, helpful, and positive community
We do not tolerate rude behavior, trolling, or vendors advertising in posts
We are here to help, just let us know what you need
You'll need to register in order to view the content of the threads and start contributing to our community. It's free for basic access, or support us by becoming an Elite Member -- see if you qualify for a discount below.
-- Big Mike, Site Administrator
(If you already have an account, login at the top of the page)
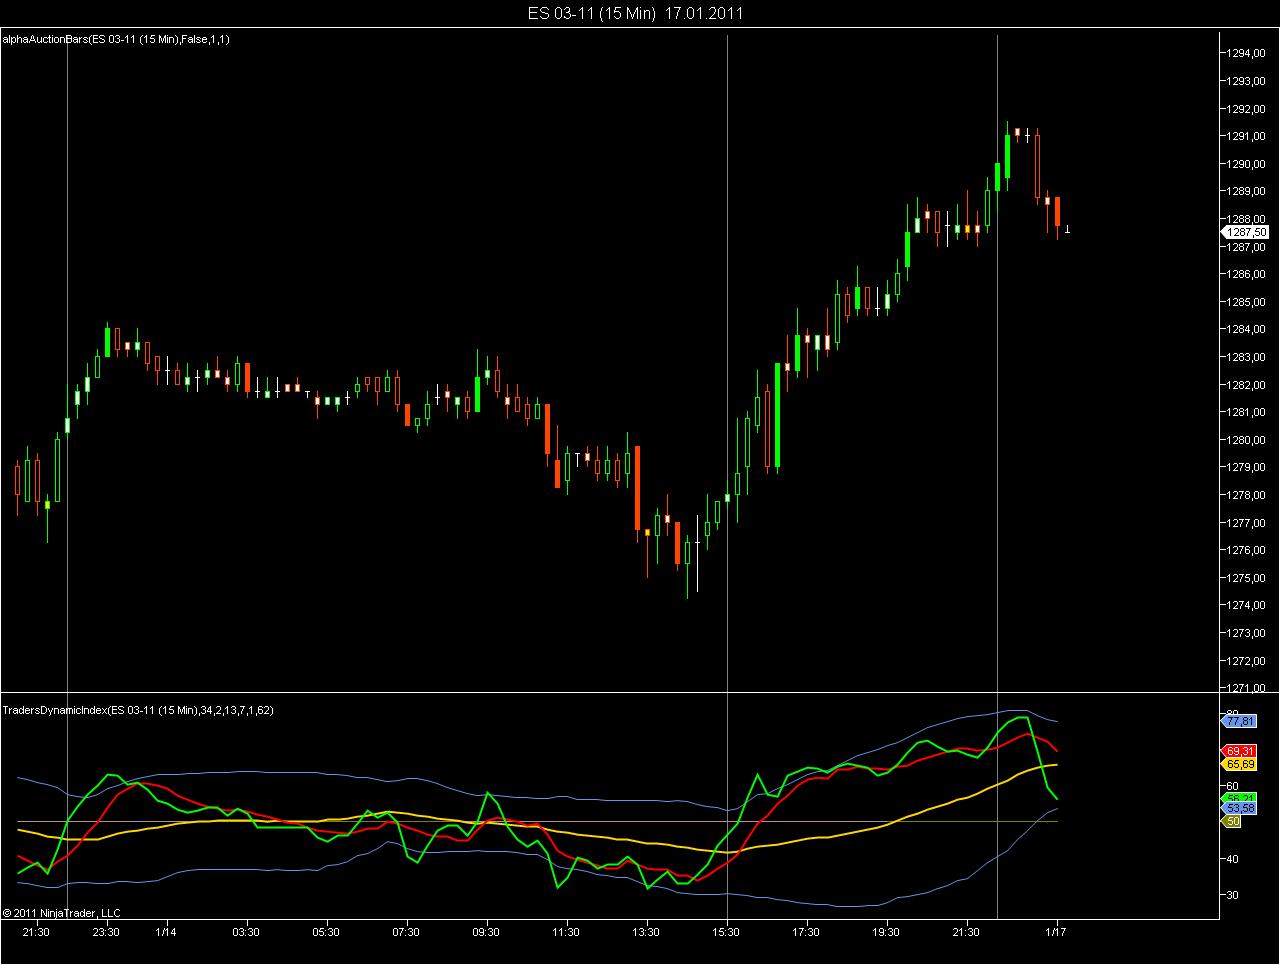
I use HA charts for my trading and use a method very similar to Dean Malone's EASY (using Price Channels) - a great filter would be the Traders Dynamic Index. I know it is freely available in MT4 but as I use NT7, I was wondering if anybody has coded it for NT 7? If not, would any programmer be interested in coding it for a fee?
Can you help answer these questions from other members on NexusFi?
RSI_Period (default = 13) period in bars for calculation of RSI.
RSI_Price (default = MODE_CLOSE) price type to use in RSI calculation.
Volatility_Band (default = 34) parameter for volatility band calculation. Can be between 20 and 40. The lower this value is the curvier becomes the band.
RSI_Price_Line (default = 2) period of the first moving average (fast).
RSI_Price_Type (default = MODE_SMA) type of the first moving average.
Trade_Signal_Line (default = 7) period of the second moving average (slow).
Trade_Signal_Type (default = MODE_SMA) type of the second moving average.
UseAlerts (default = false) if true then sound alert will be played each time red and yellow
Looks like the RSI with moving averages wrappped up in a Bollinger Band. Is that pretty much it?
I'm just a simple man trading a simple plan.
My daddy always said, "Every day above ground is a good day!"
PriceLine (green) -> 2-period SMA of RSI(13)
SignaLline (red) -> 7-period SMA of RSI(13)
Average (yellow) -> 34-period SMA of RSI(13)
Bands -> Bollinger(34, 1.62) of RSI(13)
Interesting i was using this indicator when i was in the Forex world in 2008. That was an interesting indicator to filter some conditions and Dean Malone is a very good teacher. I still get his short videos. Would be cool to have it for Ninja.
Fat Tails and my version are identical (except colors). Curious as to what instrument and chart intervals folks are using this one. When I played with on NT6.5 I could never find consistency with it.