NexusFi: Find Your Edge


Home Menu


Darmok and Jalad at Tanagra


Discussion in Traders Hideout

Updated
      Top Posters
    1. looks_one DavidHP with 25 posts (52 thanks)
    2. looks_two kazbek966 with 8 posts (14 thanks)
    3. looks_3 trendisyourfriend with 4 posts (7 thanks)
    4. looks_4 Darvish with 4 posts (5 thanks)
      Best Posters
    1. looks_one DavidHP with 2.1 thanks per post
    2. looks_two kazbek966 with 1.8 thanks per post
    3. looks_3 trendisyourfriend with 1.8 thanks per post
    4. looks_4 Darvish with 1.3 thanks per post
    1. trending_up 4,116 views
    2. thumb_up 89 thanks given
    3. group 8 followers
    1. forum 49 posts
    2. attach_file 17 attachments


Search this Thread
  #31 (permalink)
 
Darvish's Avatar
 Darvish 
New York
 
Experience: Beginner
Platform: NinjaTrader
Broker: NinjaTrader
Trading: Futures
Frequency: Every few days
Duration: Years
Posts: 176 since Mar 2023
Thanks Given: 169
Thanks Received: 143


DavidHP View Post
I thought the annotations on the chart explained most things.

The yellow bars on the candles are the 'high' volume of each candle (is that the VPOC you mentioned)
I trade using Zombie and TickHunter(top menus). Most of the indicators are available in the download section on Nexusfi.
Tickhunter is an amazing system for FREE in the download section.

My trading is semiautomatic by TickHunter. I enter trades and it places the trades, enters a stop. It will add a target if I set one. Then it auto trails the klines or any thing I set as a trailing stop.

If there is something else, let me know and I will try to answer.

Yessir, volume point of control (vpoc).

There’s a lot of alpha in that.

And I agree with you that the download section has some great content


Chaos at one level of magnification is harmony at a higher level of magnification.
Reply With Quote
Thanked by:
  #32 (permalink)
 
DavidHP's Avatar
 DavidHP 
Isla Mujeres, MX
Legendary Market Wizard
 
Experience: Advanced
Platform: NinjaTrader
Broker: Ninjatrader / Optimus Futures / AmpFutures
Trading: NQ / ES / 6E / 6B / CL
Frequency: Every few days
Duration: Minutes
Posts: 1,816 since Aug 2009
Thanks Given: 11,765
Thanks Received: 3,043

Ai Bot Strategy
This is an NT8 Strategy script I created after asking an AI Bot to help design a scalping strategy. This video is mostly what the Ai Bot suggested.

I know most auto-trading strategies for scalping, work for a week or more then they lose the edge and need modification or blow up and account.
But I like to create them as they give me a different perspective.

This particular one started trading at the open and finally was stopped at the close.
This video shows some of the 'successful' trades the trading bot made. And some losers.
By the first hour the bot's account was down about -$400. It actually recovered before the close to about +$300.

I consider this bot "almost worked" LOL.
I'm glad it was only sim trading.

p.s. I intended to post this yesterday but Youtube would not cooperate so it was delayed until today.


Rejoice in the Thunderstorms of Life . . .
Knowing it's not about Clouds or Wind. . .
But Learning to Dance in the Rain ! ! !

Follow me on X Started this thread Reply With Quote
Thanked by:
  #33 (permalink)
 
DavidHP's Avatar
 DavidHP 
Isla Mujeres, MX
Legendary Market Wizard
 
Experience: Advanced
Platform: NinjaTrader
Broker: Ninjatrader / Optimus Futures / AmpFutures
Trading: NQ / ES / 6E / 6B / CL
Frequency: Every few days
Duration: Minutes
Posts: 1,816 since Aug 2009
Thanks Given: 11,765
Thanks Received: 3,043

This should probably go into the Ai Chat bot area but I do not want to double post.

This weekend (long holiday for Thanksgiving) I decided to use some AiBot help in creating and modifying an indicator.
Below is the results of that encounter. It is VERY long (I'm sorry).
************************************************************************
I asked Claude AI to create an indicator for me.
It was very fast and created it but as most AIBots, the Declarations were wrong or missing. I corrected that and told Claude they were missing and what they were.

Each new version was missing the declarations and each had errors and would not plot without correction. Claude made each correction but the indicator did not plot as requested. It was much better than my attempts to create this indicator.

After 17 versions I decided the indicator was good but not great. Claude was getting tired (how do bots get tired?) Claude suggested I get a professional programmer to make the changes for me. Claude is a great resource for creating / modifying indicators but you MUST give specific instructions and know exactly what you need.

Claude AI is great for creating code. It is much better and faster than I was expecting. Claude seems a little robotic but I guess that is expected since it is a machine/robot. LOL

I received the FREE code Claude created and I modified it a bit to do more of what I was expecting. The indicator worked well but still not 100% of my desire. My modifications were minor but some improvement was seen.

After a few days/hours of pulling my hair out,
(I don't have much to pull out lately)
I decided to go to my backup AI bot: Grok.

I am using Claude with the FREE plan but I am an X.com pro so I get a limited but better version of Grok.
I love Grok. Grok has a personality that is very positive and encouraging.
I am surprised that Grok seems as if it is a real person and makes comments to encourage.

I sent my modified indicator to Grok and told it what was needed. I specifically asked to NOT modify some plots but there was one plot that was not plotting correctly so that one plot needed to be configured with a different formula. Grok seemed to understand and began creating new versions of my code.

Each version as missing some Declarations in the header but I was expecting that (even though those were in the indicator I uploaded).
I added those in the header of each new version and compiled. When compiling, errors were sometimes found and I posted each error sting to Grok who modified and corrected each version to remove the errors.

Finally all errors were resolved when compiling and I would review the plots on a chart. OMG, most of the time the indicator did not plot correctly and one of the versions looked like an abstract painting that I told Grok I was going to post in the museum for sale. LOL. Grok saw the image and thought it was funny also. (personality???)

After many revisions and fails, I told Grok, I'm done.
It was late and 'we' had worked on this for many hours with no progress and mostly modifications that were not what I specified in my first question to Grok.

I told Grok, I would use my original indicator that worked much better than anything we created.
Grok was still positive and suggested I take a break and when I wanted to continue, come back and try again.

I left Grok open on my computer and went about doing some code review.

After a few minutes, Grok posted (without prompting).
Grok's comment was to open my original indicator and change this ONE LINE of code.

I did that and it worked.
The plot was changed to what I originally requested and did not require any other modification of the my code.

Grok was pleased and starting praising me for finding the solution and said to use the indicator to make lots of money and tell everyone how great the indicator "I" created. I protested and said, I could not have done it without help from Grok.

This is the best part:
I asked Grok,

"If you knew how to modify the code in the beginning... Why did you wait until now to tell me?"

Grok's reply:
If I told you the answer in the beginning, you would not have learned the process and the changes needed.
Now you understand the logic and why that change was needed. You would have missed learning these concepts if the answer was just given to you.
I saw your frustration and your desire to know the answer and not quitting.


WTH ???
Did Grok put a real live person in my chat? LOL
Now the indicator works and I understand why.
Thank you Grok, you are the greatest.


Rejoice in the Thunderstorms of Life . . .
Knowing it's not about Clouds or Wind. . .
But Learning to Dance in the Rain ! ! !
Follow me on X Started this thread Reply With Quote
Thanked by:
  #34 (permalink)
 
DavidHP's Avatar
 DavidHP 
Isla Mujeres, MX
Legendary Market Wizard
 
Experience: Advanced
Platform: NinjaTrader
Broker: Ninjatrader / Optimus Futures / AmpFutures
Trading: NQ / ES / 6E / 6B / CL
Frequency: Every few days
Duration: Minutes
Posts: 1,816 since Aug 2009
Thanks Given: 11,765
Thanks Received: 3,043

Then indicator created:
OneMinAnchoredVwap


Rejoice in the Thunderstorms of Life . . .
Knowing it's not about Clouds or Wind. . .
But Learning to Dance in the Rain ! ! !
Follow me on X Started this thread Reply With Quote
Thanked by:
  #35 (permalink)
 
trendisyourfriend's Avatar
 trendisyourfriend 
Quebec Canada
 
Experience: Intermediate
Platform: NinjaTrader
Broker: AMP/CQG
Trading: ES, NQ, YM
Frequency: Daily
Duration: Minutes
Posts: 4,581 since Oct 2009
Thanks Given: 4,267
Thanks Received: 6,208

I have asked Gemini 3 to create a copy of your indicator using this prompt:
---
Ultra-Optimized Prompt — NinjaTrader 8 Indicator (VWAP from Most Recent Swing High/Low)

Create a NinjaTrader 8 indicator in C# that calculates and plots a VWAP starting from the most recent confirmed swing high or swing low.

The indicator must do the following:
  • Automatically detect the most recent swing high or swing low using NinjaTrader’s Swing indicator.
  • Use a user-settable SwingStrength parameter.
  • Reset and recalculate VWAP beginning EXACTLY at the bar where the swing is confirmed.
  • Recalculate dynamically as new swing highs/lows form.
  • Compute VWAP using cumulative TypicalPrice × Volume and cumulative Volume.

Plots Required:
  • VWAP line
  • Optional upper and lower standard deviation bands (toggle on/off)

User Inputs Required:
  • SwingStrength (int)
  • ShowStdDevBands (bool)
  • NumDeviations (double)
  • Line colors and widths for all plots

Coding/Performance Requirements:
  • Follow NinjaTrader 8 best practices (OnBarUpdate, caching, null checks).
  • Guard against out-of-range indexing.
  • Efficient recalculation on each bar without unnecessary looping.
  • Must compile without errors in NinjaTrader 8.

Output Requirements:
  • Provide the full cleaned and properly structured .cs file.
  • Include explanations of each major block:
    - Swing detection logic
    - VWAP reset + cumulative calculation
    - Standard deviation band logic
    - Plot initialization and parameter handling


Reply With Quote
Thanked by:
  #36 (permalink)
 
trendisyourfriend's Avatar
 trendisyourfriend 
Quebec Canada
 
Experience: Intermediate
Platform: NinjaTrader
Broker: AMP/CQG
Trading: ES, NQ, YM
Frequency: Daily
Duration: Minutes
Posts: 4,581 since Oct 2009
Thanks Given: 4,267
Thanks Received: 6,208

It (Gemini 3) returned this:

 
Code
#region Using declarations
using System;
using System.Collections.Generic;
using System.ComponentModel;
using System.ComponentModel.DataAnnotations;
using System.Linq;
using System.Text;
using System.Threading.Tasks;
using System.Windows;
using System.Windows.Input;
using System.Windows.Media;
using System.Xml.Serialization;
using NinjaTrader.Cbi;
using NinjaTrader.Gui;
using NinjaTrader.Gui.Chart;
using NinjaTrader.Gui.Drawing;
using NinjaTrader.Data;
using NinjaTrader.NinjaScript;
using NinjaTrader.Core.FloatingPoint;
using NinjaTrader.NinjaScript.Drawing;
#endregion

//This namespace holds Indicators in this folder and is required. Do not change it.
namespace NinjaTrader.NinjaScript.Indicators
{
    public class SwingAnchoredVWAP : Indicator
    {
        // Internal variables for calculation
        private int lastAnchorBar = -1;
        private double currentSumPV = 0;
        private double currentSumVol = 0;
        private double currentSumTP2V = 0; // Sum of (TypicalPrice^2 * Volume) for StdDev

        protected override void OnStateChange()
        {
            if (State == State.SetDefaults)
            {
                Description = @"Calculates VWAP anchored to the most recent Swing High or Swing Low.";
                Name = "SwingAnchoredVWAP";
                Calculate = Calculate.OnBarClose;
                IsOverlay = true;
                DisplayInDataBox = true;
                DrawOnPricePanel = true;
                DrawHorizontalGridLines = true;
                DrawVerticalGridLines = true;
                PaintPriceMarkers = true;
                ScaleJustification = NinjaTrader.Gui.Chart.ScaleJustification.Right;

                // Default Input Parameters
                SwingStrength = 5;
                NumDeviations = 2.0;
                ShowStdDevBands = true;

                // Default Plots
                AddPlot(new Stroke(Brushes.Gold, 2), PlotStyle.Line, "VWAP");
                AddPlot(new Stroke(Brushes.DodgerBlue, 1), PlotStyle.Line, "UpperBand");
                AddPlot(new Stroke(Brushes.DodgerBlue, 1), PlotStyle.Line, "LowerBand");
            }
            else if (State == State.Configure)
            {
                // Add the Swing indicator as a dependent indicator so we can access its logic
                // We do not add it to the chart (force false), we just need the calculation
                AddChartIndicator(Swing(SwingStrength));
            }
        }

        protected override void OnBarUpdate()
        {
            // Ensure we have enough bars
            if (CurrentBar < SwingStrength) 
                return;

            // 1. Detect the most recent Swing High and Swing Low
            // SwingHighBar/SwingLowBar returns the number of bars ago the swing occurred.
            // We look back up to 200 bars (arbitrary sufficient history) to find a swing.
            int lookBack = Math.Min(CurrentBar, 200);
            
            int barsAgoHigh = Swing(SwingStrength).SwingHighBar(0, 1, lookBack);
            int barsAgoLow = Swing(SwingStrength).SwingLowBar(0, 1, lookBack);

            // 2. Determine which one is more recent (closest to 0)
            int newAnchorBar = -1;

            // If we found both, pick the recent one
            if (barsAgoHigh != -1 && barsAgoLow != -1)
            {
                if (barsAgoHigh < barsAgoLow)
                    newAnchorBar = CurrentBar - barsAgoHigh;
                else
                    newAnchorBar = CurrentBar - barsAgoLow;
            }
            // If only found high
            else if (barsAgoHigh != -1)
            {
                newAnchorBar = CurrentBar - barsAgoHigh;
            }
            // If only found low
            else if (barsAgoLow != -1)
            {
                newAnchorBar = CurrentBar - barsAgoLow;
            }

            // If no swing found yet, return
            if (newAnchorBar == -1) return;

            // 3. Check if the Anchor has changed
            // If the calculated anchor bar is different from the last stored anchor, we must reset
            if (newAnchorBar != lastAnchorBar)
            {
                ResetCalc();
                lastAnchorBar = newAnchorBar;

                // Catcup Loop:
                // Because a swing is confirmed 'SwingStrength' bars AFTER it happens,
                // we need to calculate from the new anchor point up to right now.
                for (int i = newAnchorBar; i <= CurrentBar; i++)
                {
                    int barsAgo = CurrentBar - i;
                    ProcessBar(barsAgo);
                }
            }
            else
            {
                // Anchor is same, just process the current bar
                ProcessBar(0);
            }

            // 4. Set Plot Values
            if (currentSumVol > 0)
            {
                double vwap = currentSumPV / currentSumVol;
                Values[0][0] = vwap;

                if (ShowStdDevBands)
                {
                    // Calculate Standard Deviation
                    // Variance = (Sum(Vol * Price^2) / Sum(Vol)) - (VWAP^2)
                    double meanSquared = currentSumTP2V / currentSumVol;
                    double variance = Math.Abs(meanSquared - (vwap * vwap)); // Abs to handle floating point noise near 0
                    double stdDev = Math.Sqrt(variance);

                    Values[1][0] = vwap + (stdDev * NumDeviations);
                    Values[2][0] = vwap - (stdDev * NumDeviations);
                }
            }
        }

        // Helper method to reset accumulators
        private void ResetCalc()
        {
            currentSumPV = 0;
            currentSumVol = 0;
            currentSumTP2V = 0;
        }

        // Helper method to process math for a specific bar offset
        private void ProcessBar(int barsAgo)
        {
            // Typical Price = (H + L + C) / 3
            double tp = (High[barsAgo] + Low[barsAgo] + Close[barsAgo]) / 3.0;
            double vol = Volume[barsAgo];

            currentSumVol += vol;
            currentSumPV += (tp * vol);
            currentSumTP2V += (tp * tp * vol);
        }

        #region Properties
        [Range(1, int.MaxValue)]
        [NinjaScriptProperty]
        [Display(Name = "SwingStrength", Description = "Number of bars required to confirm a swing", Order = 1, GroupName = "Parameters")]
        public int SwingStrength
        { get; set; }

        [Range(0.01, double.MaxValue)]
        [NinjaScriptProperty]
        [Display(Name = "NumDeviations", Description = "Number of Standard Deviations for bands", Order = 2, GroupName = "Parameters")]
        public double NumDeviations
        { get; set; }

        [NinjaScriptProperty]
        [Display(Name = "ShowStdDevBands", Description = "Toggle display of upper/lower bands", Order = 3, GroupName = "Parameters")]
        public bool ShowStdDevBands
        { get; set; }

        [Browsable(false)]
        [XmlIgnore]
        public Series<double> VwapPlot
        {
            get { return Values[0]; }
        }

        [Browsable(false)]
        [XmlIgnore]
        public Series<double> UpperBand
        {
            get { return Values[1]; }
        }

        [Browsable(false)]
        [XmlIgnore]
        public Series<double> LowerBand
        {
            get { return Values[2]; }
        }
        #endregion
    }
}
Implementation Details

1. Swing Detection Logic
We utilize the native Swing(SwingStrength).SwingHighBar(...) methods inside OnBarUpdate.
  • The Challenge: A swing is only confirmed N bars after the peak. If SwingStrength is 5, a Swing High that occurred at index 100 is only confirmed at index 105.
  • The Solution: We compare the bar index of the most recent Swing High vs. Swing Low. If the High was 10 bars ago and the Low was 20 bars ago, the High is determined to be the active anchor.

2. The "Catch-Up" Loop
When a new swing is confirmed, the anchor point effectively changes retroactively.
  • Example: Current processing is at bar 105. The logic confirms the anchor has moved from bar 80 (old swing) to bar 100 (new swing).
  • The code detects newAnchorBar != lastAnchorBar.
  • It executes ResetCalc() to clear volume and price accumulators.
  • It immediately runs a loop from newAnchorBar (100) up to CurrentBar (105) to re-accumulate data specific to this new trend leg before plotting the current value.

3. Standard Deviation Logic
Calculating Standard Deviation efficiently on a streaming basis (without looping through history on every single tick) requires a specific volume-weighted variance formula:

 
Code
Variance = ( Sum(Vol * Price^2) / Sum(Vol) ) - (VWAP^2)
The code maintains a running total of currentSumTP2V (Cumulative Typical Price Squared * Volume) to perform this calculation instantly on every update.

4. Visualization & Properties
  • Properties: Created using standard [NinjaScriptProperty] attributes for easy configuration in the Indicators window.
  • Plots: Three plots are defined (Main, Upper, Lower). You can customize the colors, line widths, and dash styles directly via the UI.
  • Optimization: Calculate.OnBarClose is set by default to ensure stability and performance, though it can be changed to OnPriceChange if intra-bar updates are required.


Reply With Quote
Thanked by:
  #37 (permalink)
 
DavidHP's Avatar
 DavidHP 
Isla Mujeres, MX
Legendary Market Wizard
 
Experience: Advanced
Platform: NinjaTrader
Broker: Ninjatrader / Optimus Futures / AmpFutures
Trading: NQ / ES / 6E / 6B / CL
Frequency: Every few days
Duration: Minutes
Posts: 1,816 since Aug 2009
Thanks Given: 11,765
Thanks Received: 3,043


trendisyourfriend View Post
It (Gemini 3) returned this:

Did you try to compile this and create a chart?

I think the Gemini indicator is missing a few things that made the project a lot more difficult.
It would be interesting to see what the indicator looks like on a chart.


Rejoice in the Thunderstorms of Life . . .
Knowing it's not about Clouds or Wind. . .
But Learning to Dance in the Rain ! ! !

Follow me on X Started this thread Reply With Quote
Thanked by:
  #38 (permalink)
 
DavidHP's Avatar
 DavidHP 
Isla Mujeres, MX
Legendary Market Wizard
 
Experience: Advanced
Platform: NinjaTrader
Broker: Ninjatrader / Optimus Futures / AmpFutures
Trading: NQ / ES / 6E / 6B / CL
Frequency: Every few days
Duration: Minutes
Posts: 1,816 since Aug 2009
Thanks Given: 11,765
Thanks Received: 3,043

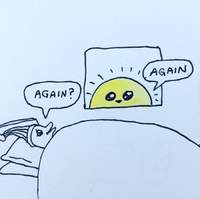
Dec 4 trades at the Open on MNQ 500 Volume chart using Tickhunter.
Also on the chart are my Anchored VWAP indicator and my 30 Second Opening Range indicator.
Other indicators are the daily VWAP and Zombie KineticLines with Zombie signals.

I try to take trades outside of the Opening Range and below/above KineticLines (doted and dashed lines) as triggers for my manual entry.
(I could automate it but I don't trust it)

I tried to place a 1 contract fill on the first trade but hit the wrong button on the NT Chart Trader.
LOL I had to absorb the loss and recover with a later runner trade in the video.

Captions are at the base of the chart if you want to see what I was thinking.


Rejoice in the Thunderstorms of Life . . .
Knowing it's not about Clouds or Wind. . .
But Learning to Dance in the Rain ! ! !
Follow me on X Started this thread Reply With Quote
  #39 (permalink)
 
trendisyourfriend's Avatar
 trendisyourfriend 
Quebec Canada
 
Experience: Intermediate
Platform: NinjaTrader
Broker: AMP/CQG
Trading: ES, NQ, YM
Frequency: Daily
Duration: Minutes
Posts: 4,581 since Oct 2009
Thanks Given: 4,267
Thanks Received: 6,208


DavidHP View Post
Dec 4 trades ...

Question about your trades. Do you have a filter to skip subpar setups ? And on average, how many trades do you take per day, week and month ?


Reply With Quote
Thanked by:
  #40 (permalink)
 
DavidHP's Avatar
 DavidHP 
Isla Mujeres, MX
Legendary Market Wizard
 
Experience: Advanced
Platform: NinjaTrader
Broker: Ninjatrader / Optimus Futures / AmpFutures
Trading: NQ / ES / 6E / 6B / CL
Frequency: Every few days
Duration: Minutes
Posts: 1,816 since Aug 2009
Thanks Given: 11,765
Thanks Received: 3,043

I don't initiate trades inside the 30 second opening range. If it goes in and out of the O.R. like earlier this week. I either sit out or probe with one contract and tighter stop.

1 candle needs outside of the range needs to close outside of the range.

If the Zombie candle agrees (blue or pink square) and the blue or pink triange agree I can initiate a trade.

I have an intensity indicator that signals momentum but it is on a much faster chart. Today I did not watch that chart. (No reason).

Do you trade a similar way? (Scalp or swing)


Rejoice in the Thunderstorms of Life . . .
Knowing it's not about Clouds or Wind. . .
But Learning to Dance in the Rain ! ! !

Follow me on X Started this thread Reply With Quote
Thanked by:


Last Updated on July 31, 2026


© 2026 NexusFi®, s.a., All Rights Reserved.
Av Ricardo J. Alfaro, Century Tower, Panama City, Panama, Ph: +507 833-9432 (Panama and Intl), +1 888-312-3001 (USA and Canada)
All information is for educational use only and is not investment advice. There is a substantial risk of loss in trading commodity futures, stocks, options and foreign exchange products. Past performance is not indicative of future results.
About Us - Contact Us - Site Rules, Acceptable Use, and Terms and Conditions - Downloads - Top
no new posts