Welcome to NexusFi: the best trading community on the planet, with over 150,000 members Sign Up Now for Free
Genuine reviews from real traders, not fake reviews from stealth vendors
Quality education from leading professional traders
We are a friendly, helpful, and positive community
We do not tolerate rude behavior, trolling, or vendors advertising in posts
We are here to help, just let us know what you need
You'll need to register in order to view the content of the threads and start contributing to our community. It's free for basic access, or support us by becoming an Elite Member -- see if you qualify for a discount below.
-- Big Mike, Site Administrator
(If you already have an account, login at the top of the page)
Well, that breakdown happened too quick for me to post. But I did trade it
OK, always nice to end the day on such a positive note and trade.
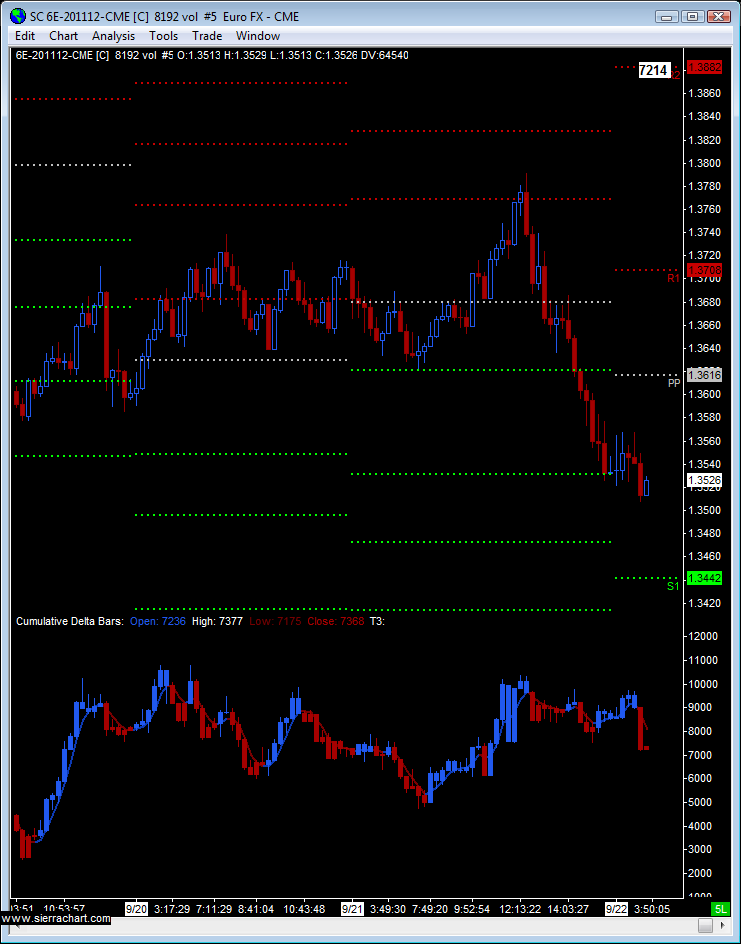
The bigger chart also shows some capitulation as we break down to new session lows.
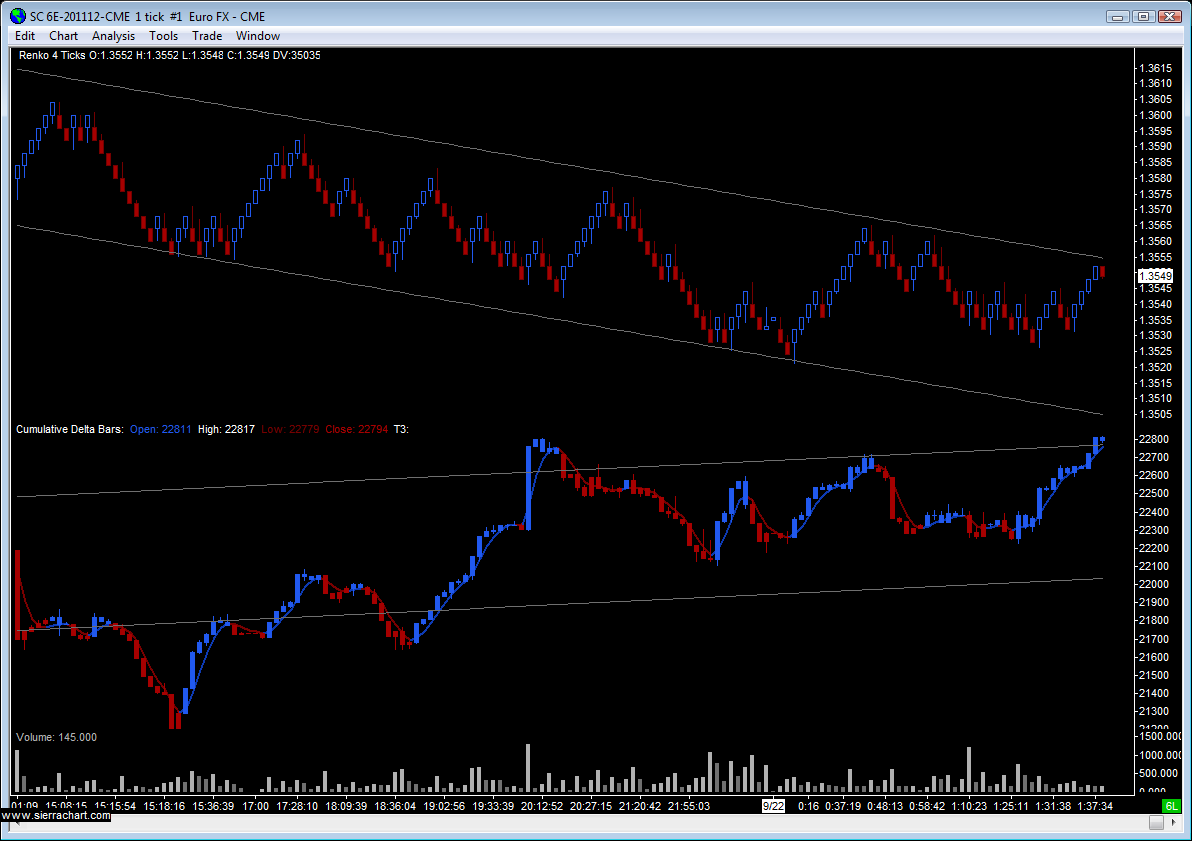
You may have noticed, I held through the pullback around 2am on my chart (4 renko). That is because at that time, cumulative delta supported it and I am using that as a determining decision factor in my current trades. But, as soon as the market failed to breakout with new highs, and we saw CDV turn in some LH's, that was when I exited half the position, and then moments later was flat after another LH.
I write this just so you can try to understand my reasoning. I hope it is helpful.
Many many many trapped longs adding fuel to that downward spiral there on the CDV chart you posted and commented on. CDV is very amazing with all markets, with the 6E it looks no different.
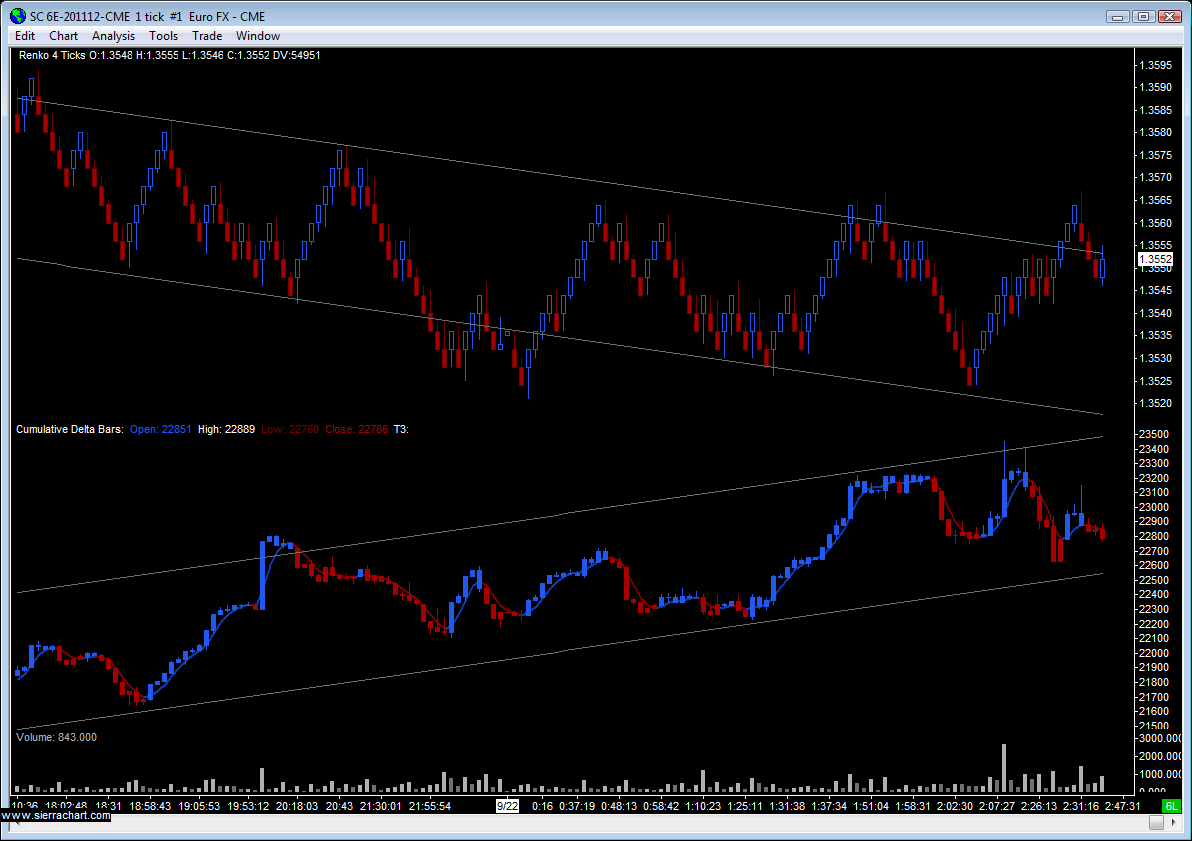
Just comparing charts.
I see some differences in the CD plot between mine and Mike's in all the charts I have compared.
It is not explained by the different bar type(I use better renko)
My CD plot however is in effect identical to the one posted earlier by Sam028 though.
Not sure why this is the case. Seems to be a difference between SC and Gomi CD plots.


 ...such is the life with a Euro trader...