Welcome to NexusFi: the best trading community on the planet, with over 150,000 members Sign Up Now for Free
Genuine reviews from real traders, not fake reviews from stealth vendors
Quality education from leading professional traders
We are a friendly, helpful, and positive community
We do not tolerate rude behavior, trolling, or vendors advertising in posts
We are here to help, just let us know what you need
You'll need to register in order to view the content of the threads and start contributing to our community. It's free for basic access, or support us by becoming an Elite Member -- see if you qualify for a discount below.
-- Big Mike, Site Administrator
(If you already have an account, login at the top of the page)
Your thread was about an illusion, not about trading off random lines.
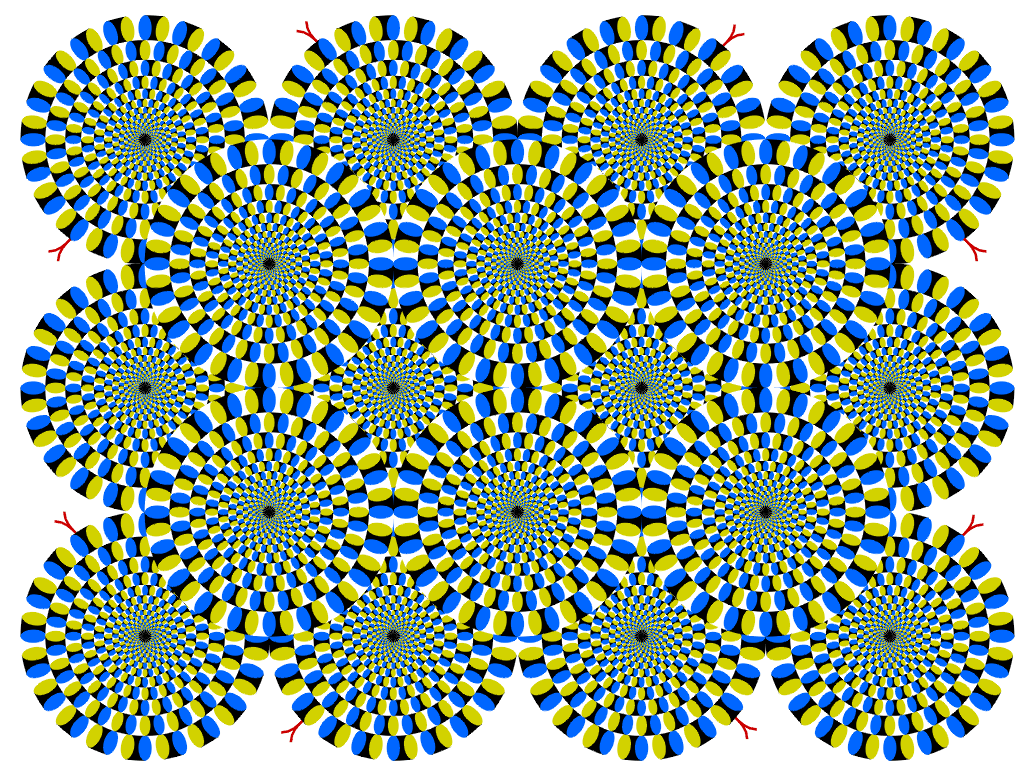
Before you give up, let us make a test. Below is a simple picture. None of its parts move.
If you see anything that moves it indicates that you have been staring at your random lines for too long and now are likely to suffer from trader's schizophrenia. You are watching how your brain cheats you. Please click to enlarge for the test.
I think the idea of this thread is interesting as it showed that a line whether random or not can play a similar role in our psyche as one that is put there on purpose or based on a mathematical model or equation like the daily pivots. However, there should be a next step or follow up to this experience as it will serve no usefull purpose.
That is an amazing picture...... I see lots of lines moving in different directions. Does this mean that I should either get a new brain or stop trading? or possibly both....
You only need a new brain, if you are not satisfied with the brain as it is. If you watch the picture and the lines are moving, you are watching the activity of your own brain. Fascinating, isn't it? Can you stand it or does it make you dizzy?
You only need to stop trading, if you are not satisfied with your results.... I am repeating myself, sorry.
I have just posted the illusions, because for me this is the essential message of the random lines:
Our brain interprets random events as having a cause.
Examples:
Random Lines: What ever line you draw, with hindsight it may look, as if it had an impact on price. Fake lines look as convincing as real S/R lines. It is difficult to separate fake from real lines. By the way, a real line is a line that creates S/R via self-fulfilling prophecy. This is the only way that S/R can be created. You can separate real S/R lines from fake lines via a backtest. You cannot separate them visually, because you will be fooled by your brain. Your brain will happily integrate price action with the fake lines and create a non-existent causal relationship.
Random Chart: In a similar way you can produce random charts, and our brains will lure us into finding false trend lines, support and resistance levels. I have found the 10 charts below on the web.