Welcome to NexusFi: the best trading community on the planet, with over 150,000 members Sign Up Now for Free
Genuine reviews from real traders, not fake reviews from stealth vendors
Quality education from leading professional traders
We are a friendly, helpful, and positive community
We do not tolerate rude behavior, trolling, or vendors advertising in posts
We are here to help, just let us know what you need
You'll need to register in order to view the content of the threads and start contributing to our community. It's free for basic access, or support us by becoming an Elite Member -- see if you qualify for a discount below.
-- Big Mike, Site Administrator
(If you already have an account, login at the top of the page)
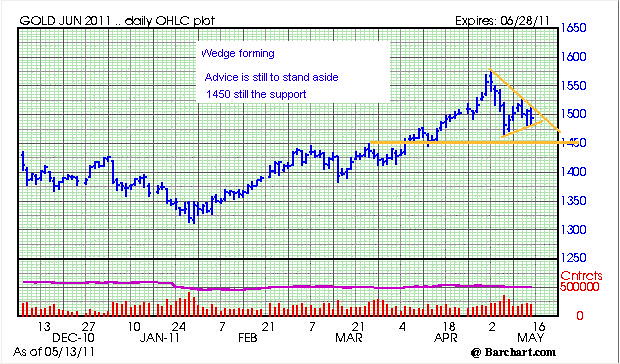
From 5 May "Looking for 1450 before this pullback can be held."
Continue to stand aside until this wedge is broken.
1450 continues to be the support.
Looking for 1450 before this pullback can be held. Watch for action at that level. Daily gold chart
..........
peace, love and joy to you
.........
Can you help answer these questions from other members on NexusFi?
I write:
April 01 "good to buy with a target of 1480". -(gold=1429 April 11, target met with 1478)
April 20 "Next target 1518 and then 1550." (gold=1500, April 25, 1518 achieved & 29 April=1550 achieved)
after the peak I write:
May 01 "a pullback is starting to form and if the 1520 doesn't hold then 1480 - lower red line." (gold=1555. May 5=1480 achieved.)
May 05 "looking to 1450 before support." (gold =1480)
May 08 "1507-1515 area down toward 1450"
So I guided up from1429 on 1 April to the peak 1577 (my target 1550) giving +$111 dollars profit of the move.Then I guided down from 1555 to 1450 area (only 1477 so far) giving +78 dollars more profit of the move. Total=$189 dollars of move 27 trading days.
Then you write:
11 May "anyone into calling a bottom? 1,380 anyone? by Friday?"
13 May "I get the feeling gold is about to punch thru its low of 1,477 in the next hr ... anyone else see that coming?"
----------------
What's going on here Don? On 1 May I speak of a pullback give 1520 and 1480 as the targets - they are met - 1480 right on - then 8 May I wrote a bounce and down (this happens 11May bounce 1526 then down) and now you write:
"anyone else see that coming?" (Am I not someone else? not sure if you saw it coming but I don't see your post telling us of you seeing it coming - did I miss it?) and you wrote "1380 by friday.? " (we are at Friday and the close is 1493 so from only 2 days away you are only off by 113pts).
Basically, I feel you are either not reading what I am posting or you are and then taking some of it as stuff you wrote. Not a big deal but when I spend time making up a chart and have targets and they are hit, and you talk 1380 in 2 days (no chart) it trashes the thread. Let's have some analysis for why 1380 in 2 days.
(Marketwatch is the place for pulling numbers out of the air - pages and pages of "did anyone else see that coming?" and "technical analysis is useless - this time its different".)
Gold closed below the 18 DMA of closes ($1,512) but it didn't clearly establish the downtrend by taking out $1,476. It's looks like a breakout to the downside looming for Mon/Tues. I thought it was going there this afternoon, but oil did an unexpected late day u-turn, and gold followed suit. (Darn)
Influences:
- The US Dollar Index reached up to $76. 14 today. It could be the top of the rally. However, the Euro looks like it will continue to soften next week (dollar up, gold down if that happens)
- The CRB index, in a downtrend for the last 10 days has momentum to the downside indicating the slide in commodities is not yet over. (continued slide means dollar up, gold down)
- The S&P looks to me like the correction is imminent. (equities market correction equals dollar up, gold down)
Adding it all up, i'm placing my bet on gold breaking out to the downside next week, and looking for $1,440 range. However in order for this to happen, it seems oil cannot be going up. This fact is the one little fly in the ointment of the falling gold-price scenario. As for a steep correction, sure anything's possible. Interest rates look like they are going to remain low, the single biggest factor (correct?), so i don't see a deep correction in the crystal ball. This could all be over in 2 weeks, with gold ticking up to $1,600 again in no time flat. Much depends on the global confidence in the USD, inflationary pressures, and what oil does and China's inflation, meanwhile beating on in the background unstopped are the deflationary forces of a crashing US housing market and rising real unemployment (i.e. the real effects of a real depression) and the GDP numbers inflated by finance, a wholly non-productive parasitic economic sector, and growing.
The Louise Yamada interview audio is now up on Kingworldnews. Really good interview. Eric rattled off all the questions we all want answers to, and Louse answered them one by one, as if slamming home runs with one hand tied behind her back. From Louise comes the one last piece of the puzzle i was looking for, that being the oil/gold price correlation required for the gold correction - the magic number is oil $92.00. So in order for gold to correct to some number like $1,440 (she says $1,450 is on her chart) oil will obviously be in a downturn. In March Louise Yamada was calling for oil at $140 in 2011 (see King's previous interview). Now i know they have resolved this predicament by forecasting oil to pullback to $90-92 before it takes off to $140. Good info, appreciative to hear it. So one possible scenario to unfold; some trigger causes oil to drop by say $5 to $7 dollars, CRB continues to slide, dollar strengthens, and gold takes the awaited plunge. I wonder what it will be.
With many hedge funds having moved into gold and gold being a one-way trade for the last year, the
current price action may signal that trend is coming to a close. If the uptrend is broken, then the movement of the
large funds out of gold and the retail traders in the gold EFTs could start a sharp downmove.
This weekend in reviewing the gold charts I feel the 1350 is the current support and 1320 is the next level.
If 1320 fails to hold then the sharp correction scenario may unfold.
Don,
The quote you posted is from January 17th, 2011, 12:01 AM when the close was 1363.60 (see page 1 of the thread). Since that post gold fell to down to 1322 on January 25th, 2011. So the text in the post was exactly correct -see below for graph.
It looks as if you are deliberately trying to mislead people by quoting me without a date 5 months later and the implication I had just made that post with "now you're scaring me".
Just noticed this buddy and FWIW I'm sure Don wasn't trying to screw with any ones head. Looks like he could have mistook and old thread for a new one. It happens.
In the silver thread I said that anyone could have made 35K on a trade I told people about (stroking my ego on drinking night). What I meant was 3.5K and pm'ed you the correct $ before I posted. Some people probably thought I was FOS too.
Don is good people, I value his .02 and has real money tied up in gold. I'm 100% he's just trying to get on the right side of upcoming moves like you or I.