Welcome to NexusFi: the best trading community on the planet, with over 150,000 members Sign Up Now for Free
Genuine reviews from real traders, not fake reviews from stealth vendors
Quality education from leading professional traders
We are a friendly, helpful, and positive community
We do not tolerate rude behavior, trolling, or vendors advertising in posts
We are here to help, just let us know what you need
You'll need to register in order to view the content of the threads and start contributing to our community. It's free for basic access, or support us by becoming an Elite Member -- see if you qualify for a discount below.
-- Big Mike, Site Administrator
(If you already have an account, login at the top of the page)
ahhh TY Mike now i see what you mean, yes thats what i was looking at on the h1 at the low of day. do you look at this on your bigger t/f ( can be very usefull imvho) can give you a bias to execute from on your lower t/f, also your bigger tf chart had nice CD at the vol spike at the lows ( hence my interest in it)
BTW, one of my motto's "trade what you see". And right now what I see is an uptrend. But no more trading today. Of course as I type this, price is hugging the very bottom of that uptrend channel, but still, delta is also in an uptrend since early morning US open.
If I were to try and guess tomorrow and Sunday/Monday moves, I would say a retracement higher, perhaps to 1.3650 area, followed by additional selling to new lows of 1.33 and below.
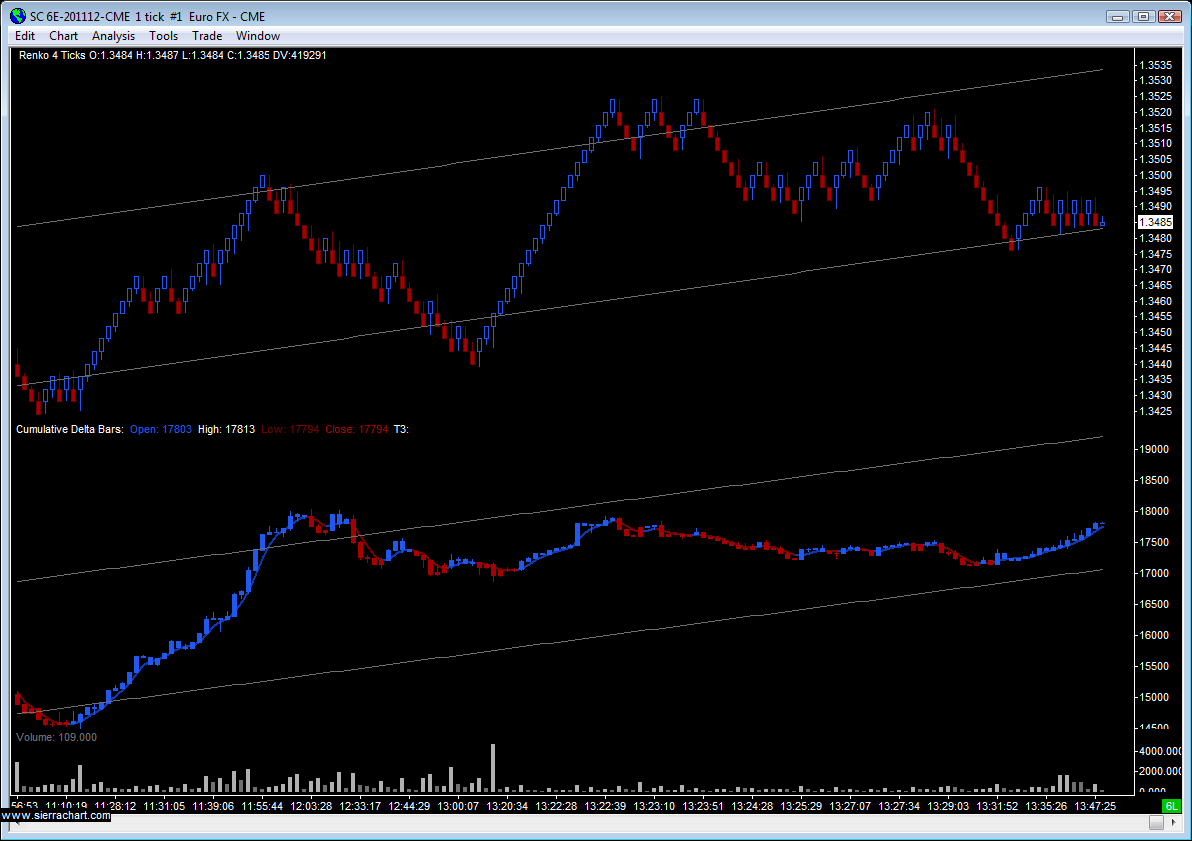
A good visual example of why there are no magical indicators. This channel would still be respected if it were simply widened to a higher setting of deviations, as illustrated by my manually drawn purple line.
You can see a good amount of weakness here too, but it gets harder to really feel sure about this interpretation because the session is near end of day, volume is declining, and with it the delta 'relative volume' declines too. But it is showing some divergence off those highs. Relatively inconsequential volume however, a delta of only 500 contracts.
On top of that, the real reason I still feel bearish on a bigger picture (regardless of any short-term pullback or retracement we might see) is the bigger delta of 5000-6000 contracts as shown in the below shot, and that is just today:
to share a chart not a whole chart book( ninja workspace equivalent ), click on a chart, F6, type chart template name in study collection box, save all, this will share the lay out of all studies on that chart, save single will share the highlight study only. To share a whole chart book , file , save as, type in chartbook name. Singlechart template has extention .StdyCollct whole book template has extension .cht, both will be in \SierraChart\data folder.
Note: recipient needs to have same studies already loaded in order to see the same layout.