Welcome to NexusFi: the best trading community on the planet, with over 150,000 members Sign Up Now for Free
Genuine reviews from real traders, not fake reviews from stealth vendors
Quality education from leading professional traders
We are a friendly, helpful, and positive community
We do not tolerate rude behavior, trolling, or vendors advertising in posts
We are here to help, just let us know what you need
You'll need to register in order to view the content of the threads and start contributing to our community. It's free for basic access, or support us by becoming an Elite Member -- see if you qualify for a discount below.
-- Big Mike, Site Administrator
(If you already have an account, login at the top of the page)
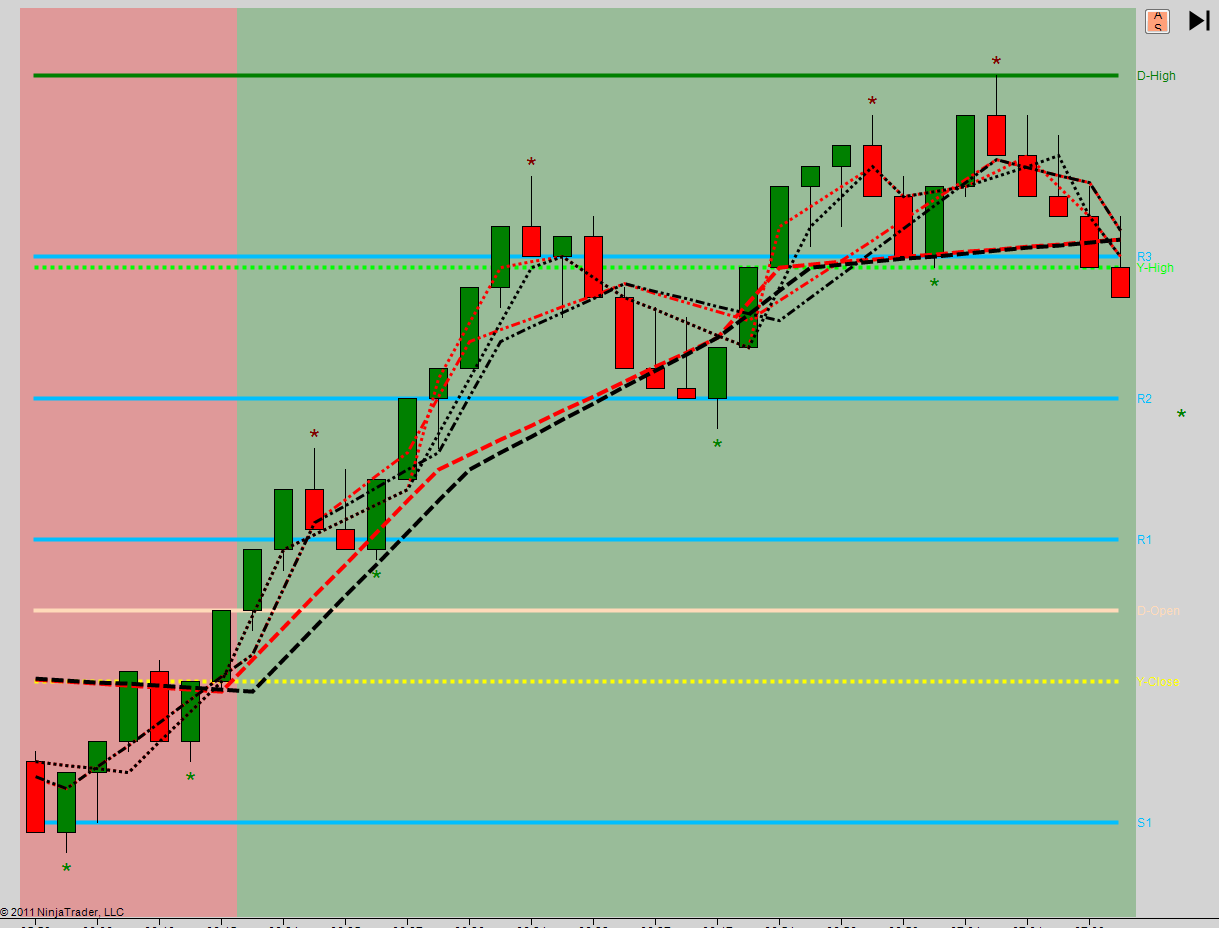
getting pretty drastic differences in plots with the same options set.. Black is the current visualSMA lines, and the equal counterparts are the newvisualSMA lines colored in red:
dont believe anything you hear and only half of what you see
This is still a bug in the new indicator, will change the code and post it later. Nothing serious, just forgot to implement the Typical Price correctly, so it is displaying the Close.
I use X for experimental, it was a pre-version. There is a learning curve involved in coding MTF indicators, I am gradually getting better at it. An expert is somebody, who has made every possible mistake.
I really suggest to switch to the newest version available in the download section of the forum. I am learning from my own and other people's mistakes and adapt the indicators accordingly.
I now recommend the new test version as it is faster, more stable and also has a reduced lag depending on the bar series loaded.
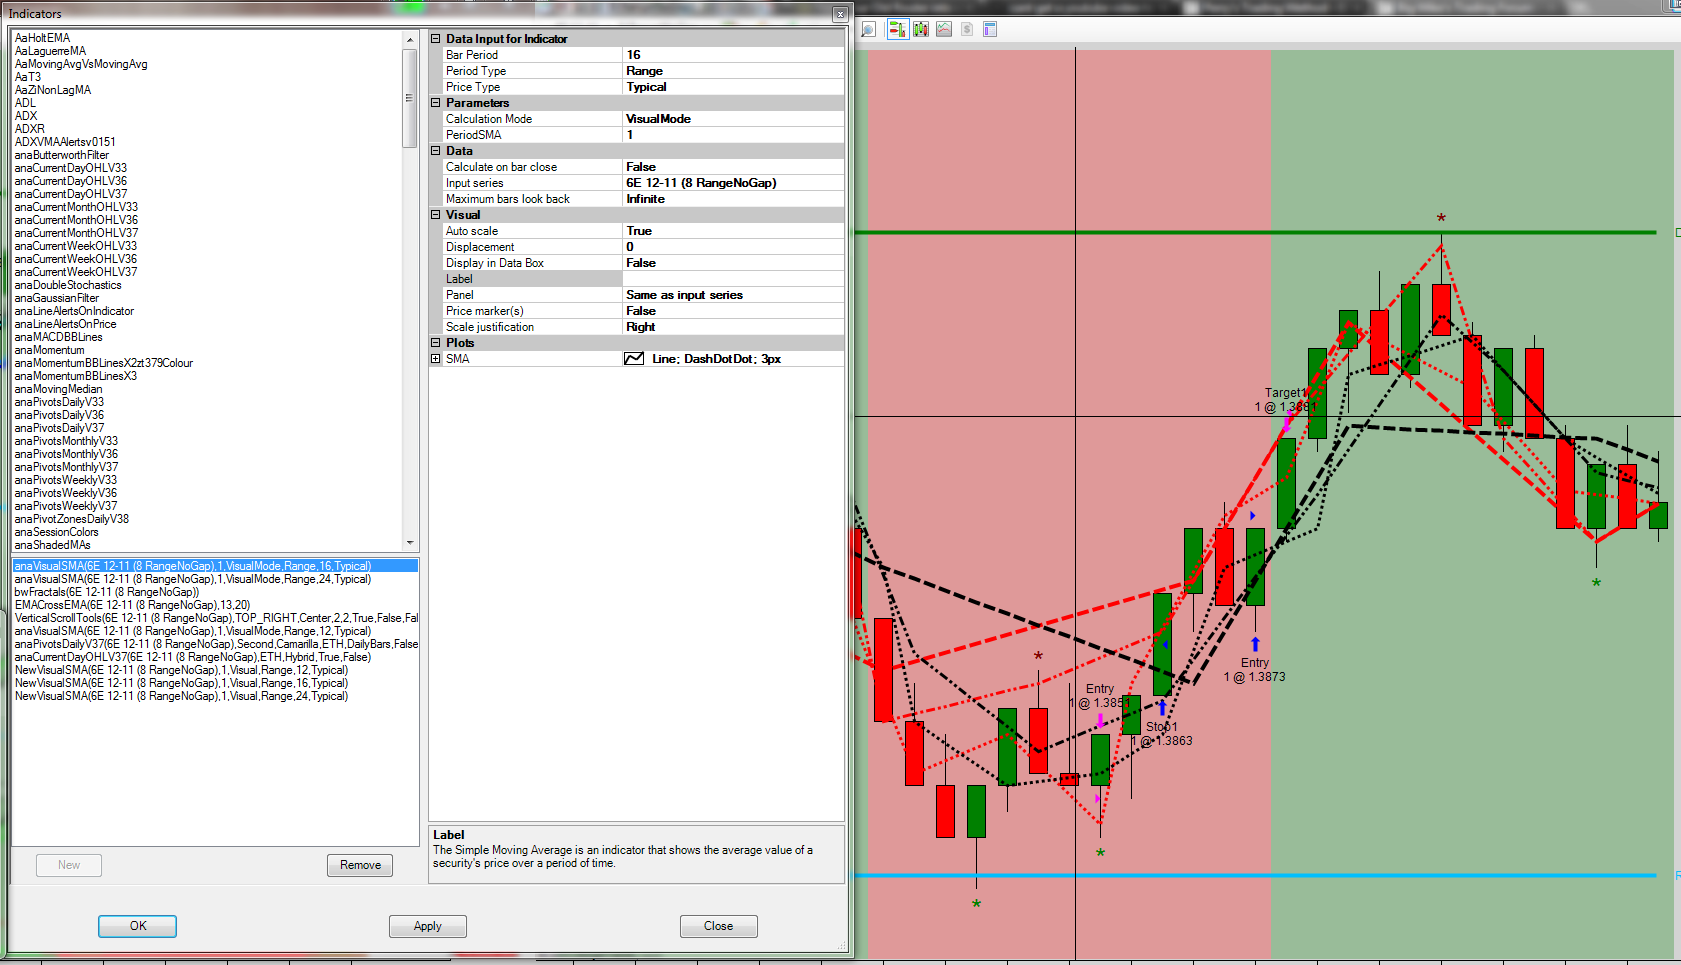
Suggest that you test again now. I have now added that little feature, which allows to set the Typical Price, High, Low. The chart below shows the indicator in OneTickCorrection Mode and Visual Mode applied to the high, low and typical of a 30 min bar series.
I have also found two minor other bugs, so I suggest that the few who have downloaded the first version swap it for this one.
I have been further digging into the NinjaTrader architecture, and the result is a simpler version of the VisualSMA and the VisualEMA. The new versions were entirely recoded from scratch and the code is about 80 lines shorter than the code of the previous …
If you look at the chart, you will note that in some places the new version (red) leads the old version (black) by one bar. This would be an improvement. Is your chart data historical or real-time data?


 dont believe anything you hear and only half of what you see