Welcome to NexusFi: the best trading community on the planet, with over 150,000 members Sign Up Now for Free
Genuine reviews from real traders, not fake reviews from stealth vendors
Quality education from leading professional traders
We are a friendly, helpful, and positive community
We do not tolerate rude behavior, trolling, or vendors advertising in posts
We are here to help, just let us know what you need
You'll need to register in order to view the content of the threads and start contributing to our community. It's free for basic access, or support us by becoming an Elite Member -- see if you qualify for a discount below.
-- Big Mike, Site Administrator
(If you already have an account, login at the top of the page)
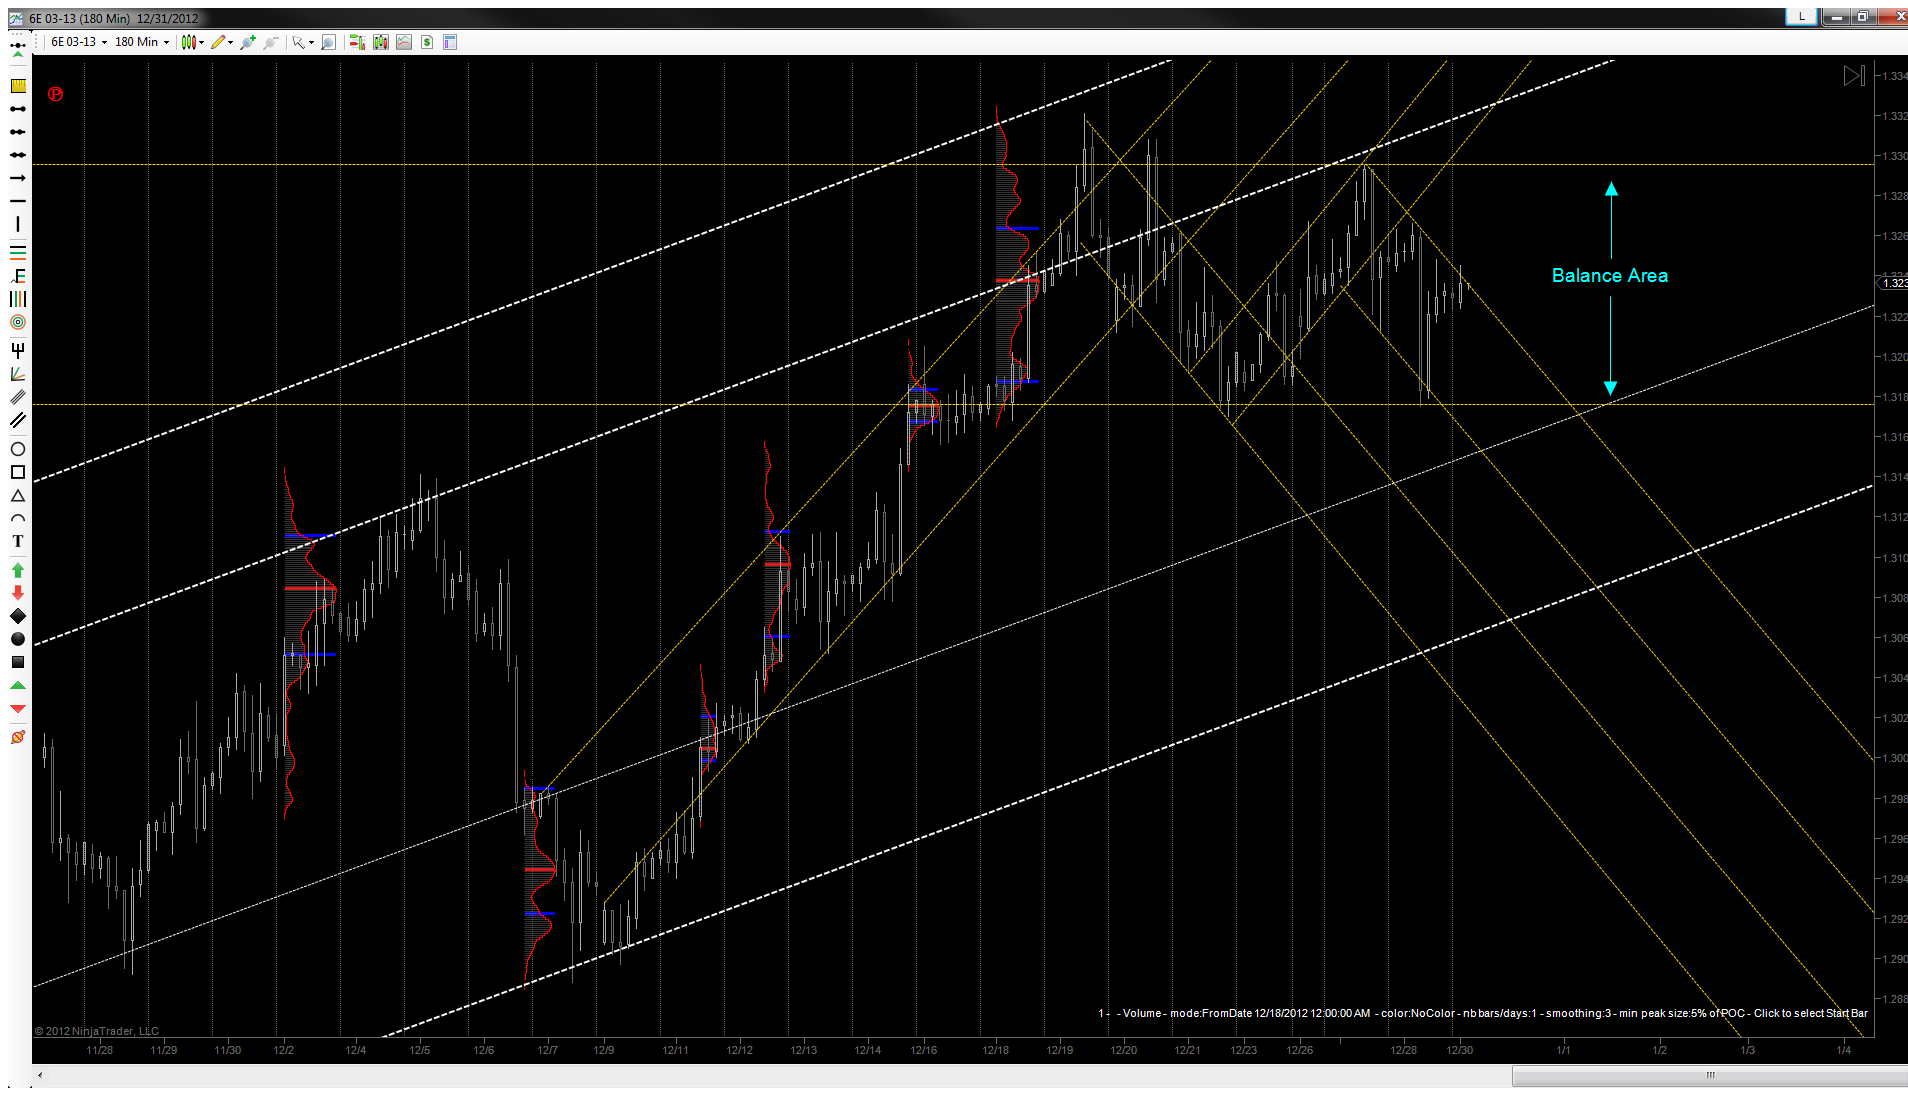
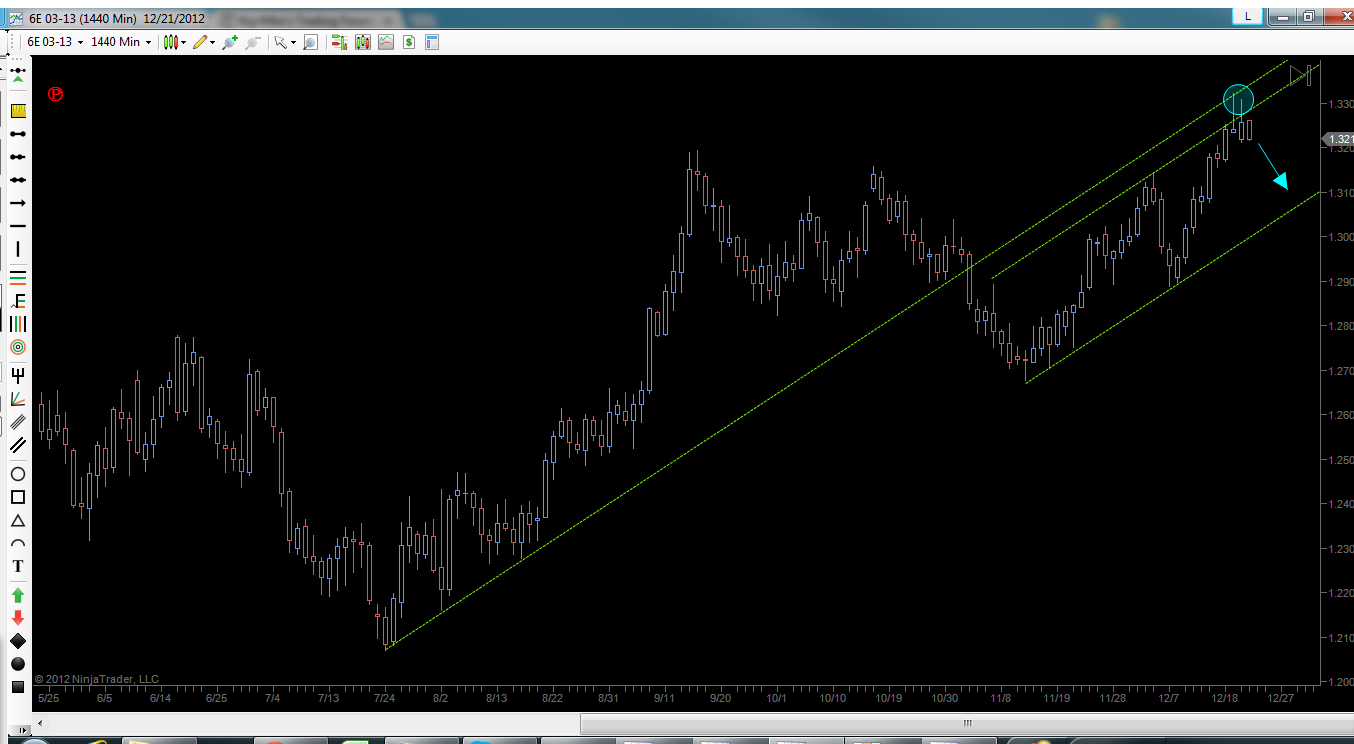
Big picture I still think we are in a bull market, however I think we need a correction of some sort given the long wicks and channel on the daily chart:
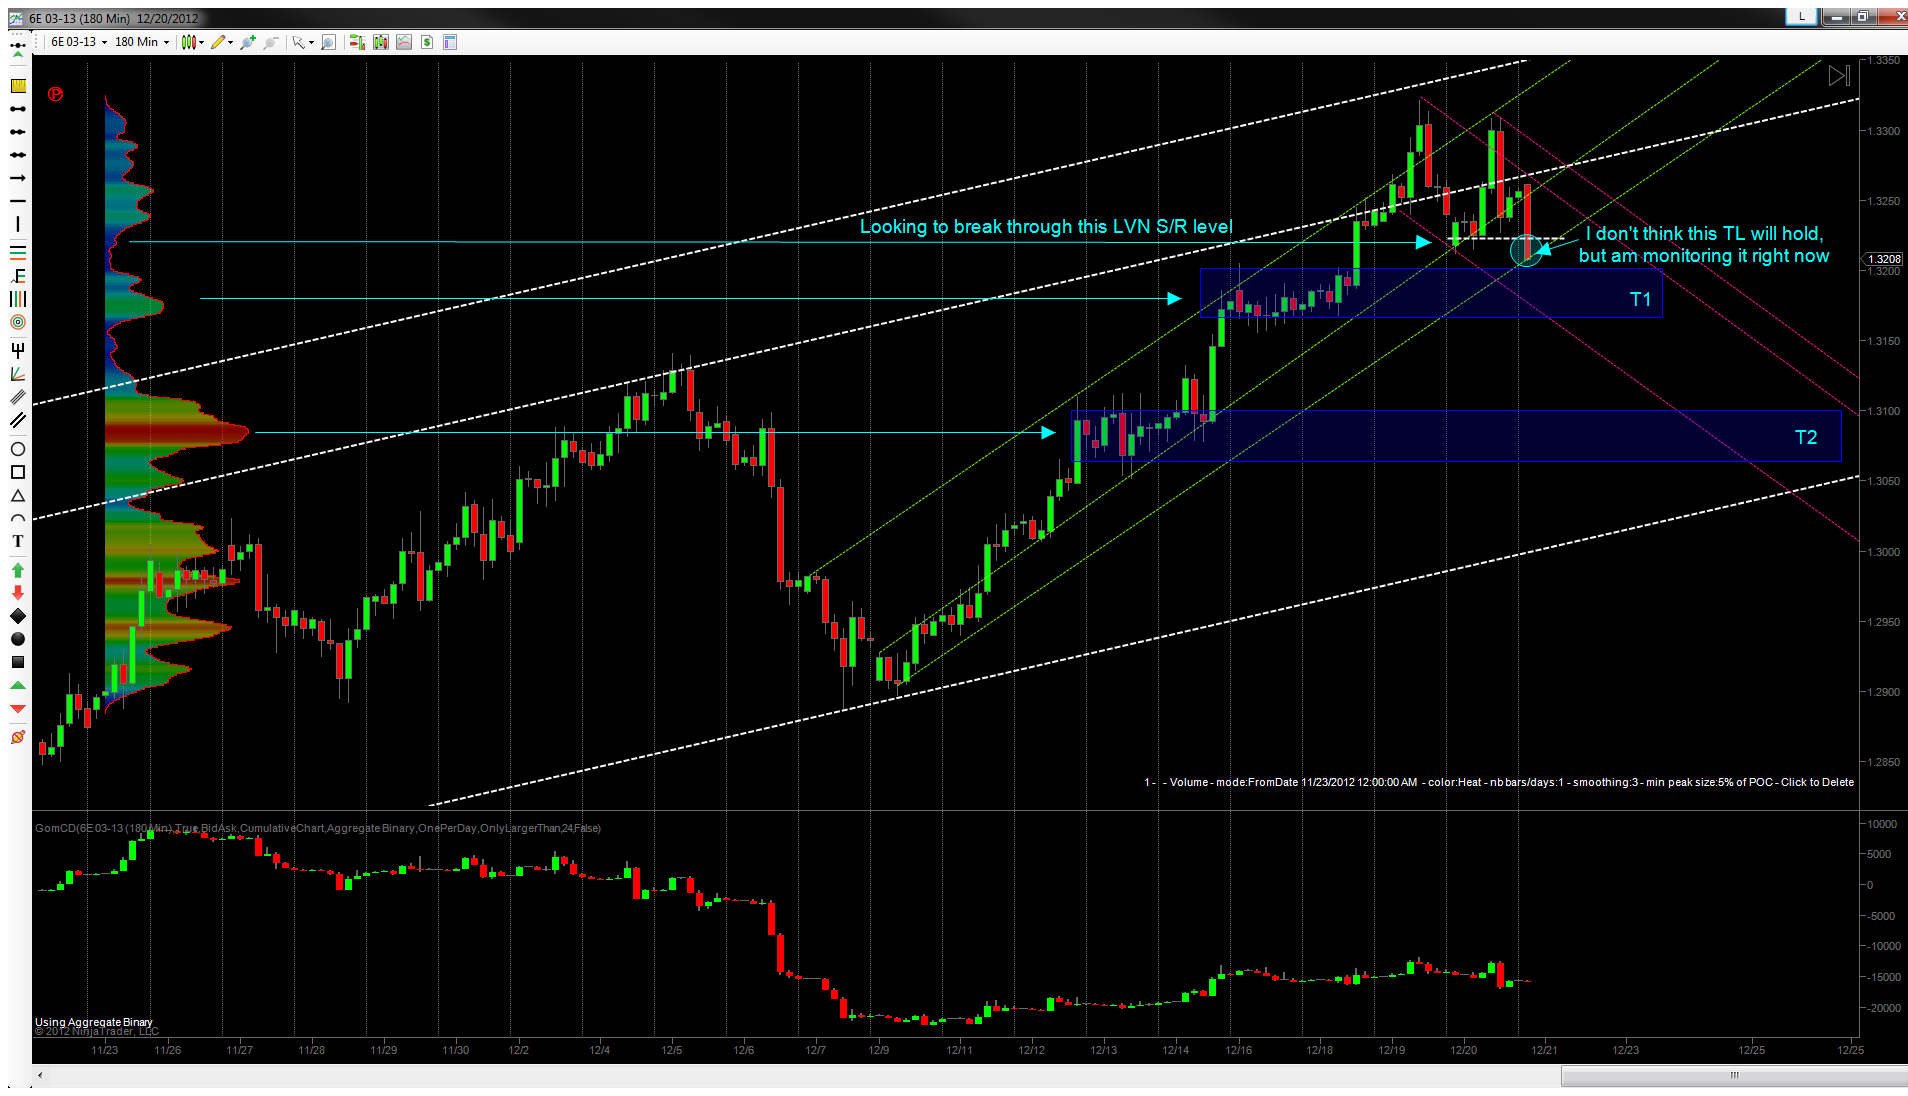
Right now we are at a LVN S/R level @3220, but I think we will break to the downside. I don't think the older TL will hold on the 3hr chart, so I am looking to drop to the next acceptance HVN area @3180. From there I think we could go either way, but I think we will go down near the bottom of the daily channel:
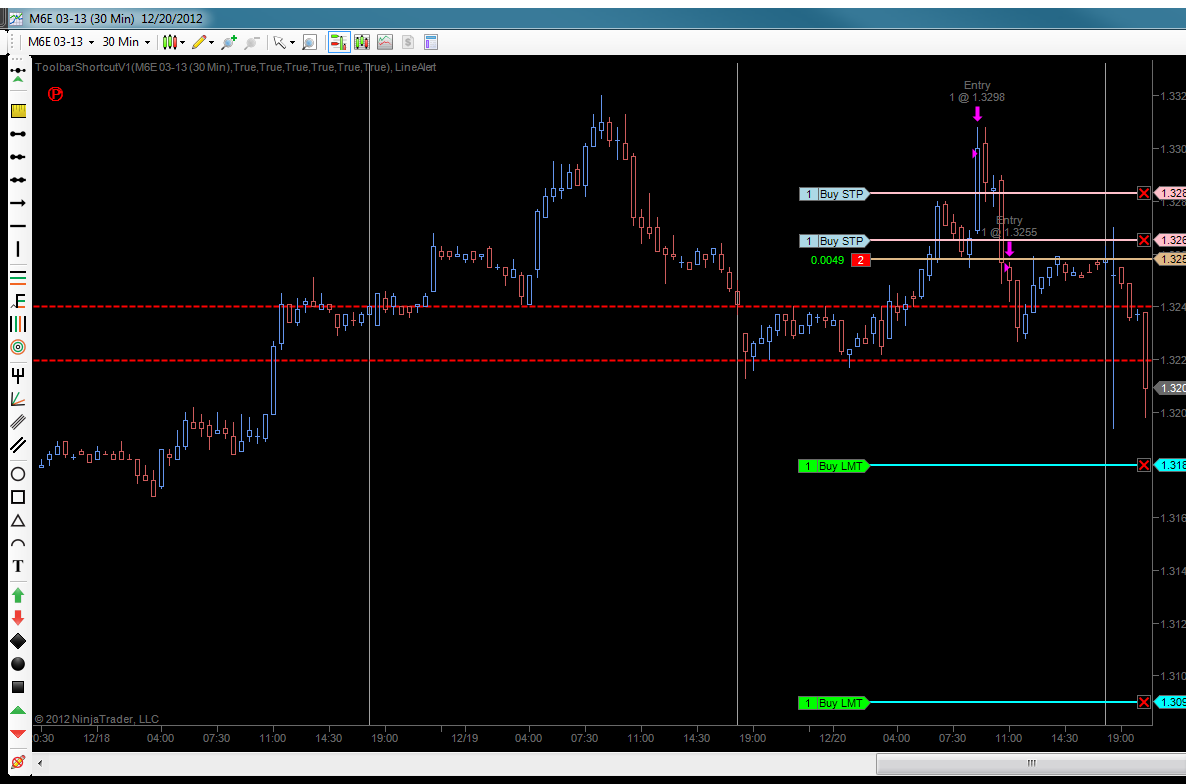
I am averaged in @3277, so here comes the difficult part for me: MANAGING A TRADE PROPERLY We just broke the 3020 level, so I am hoping it holds. Got some alert lines to wake me up if they are crossed:
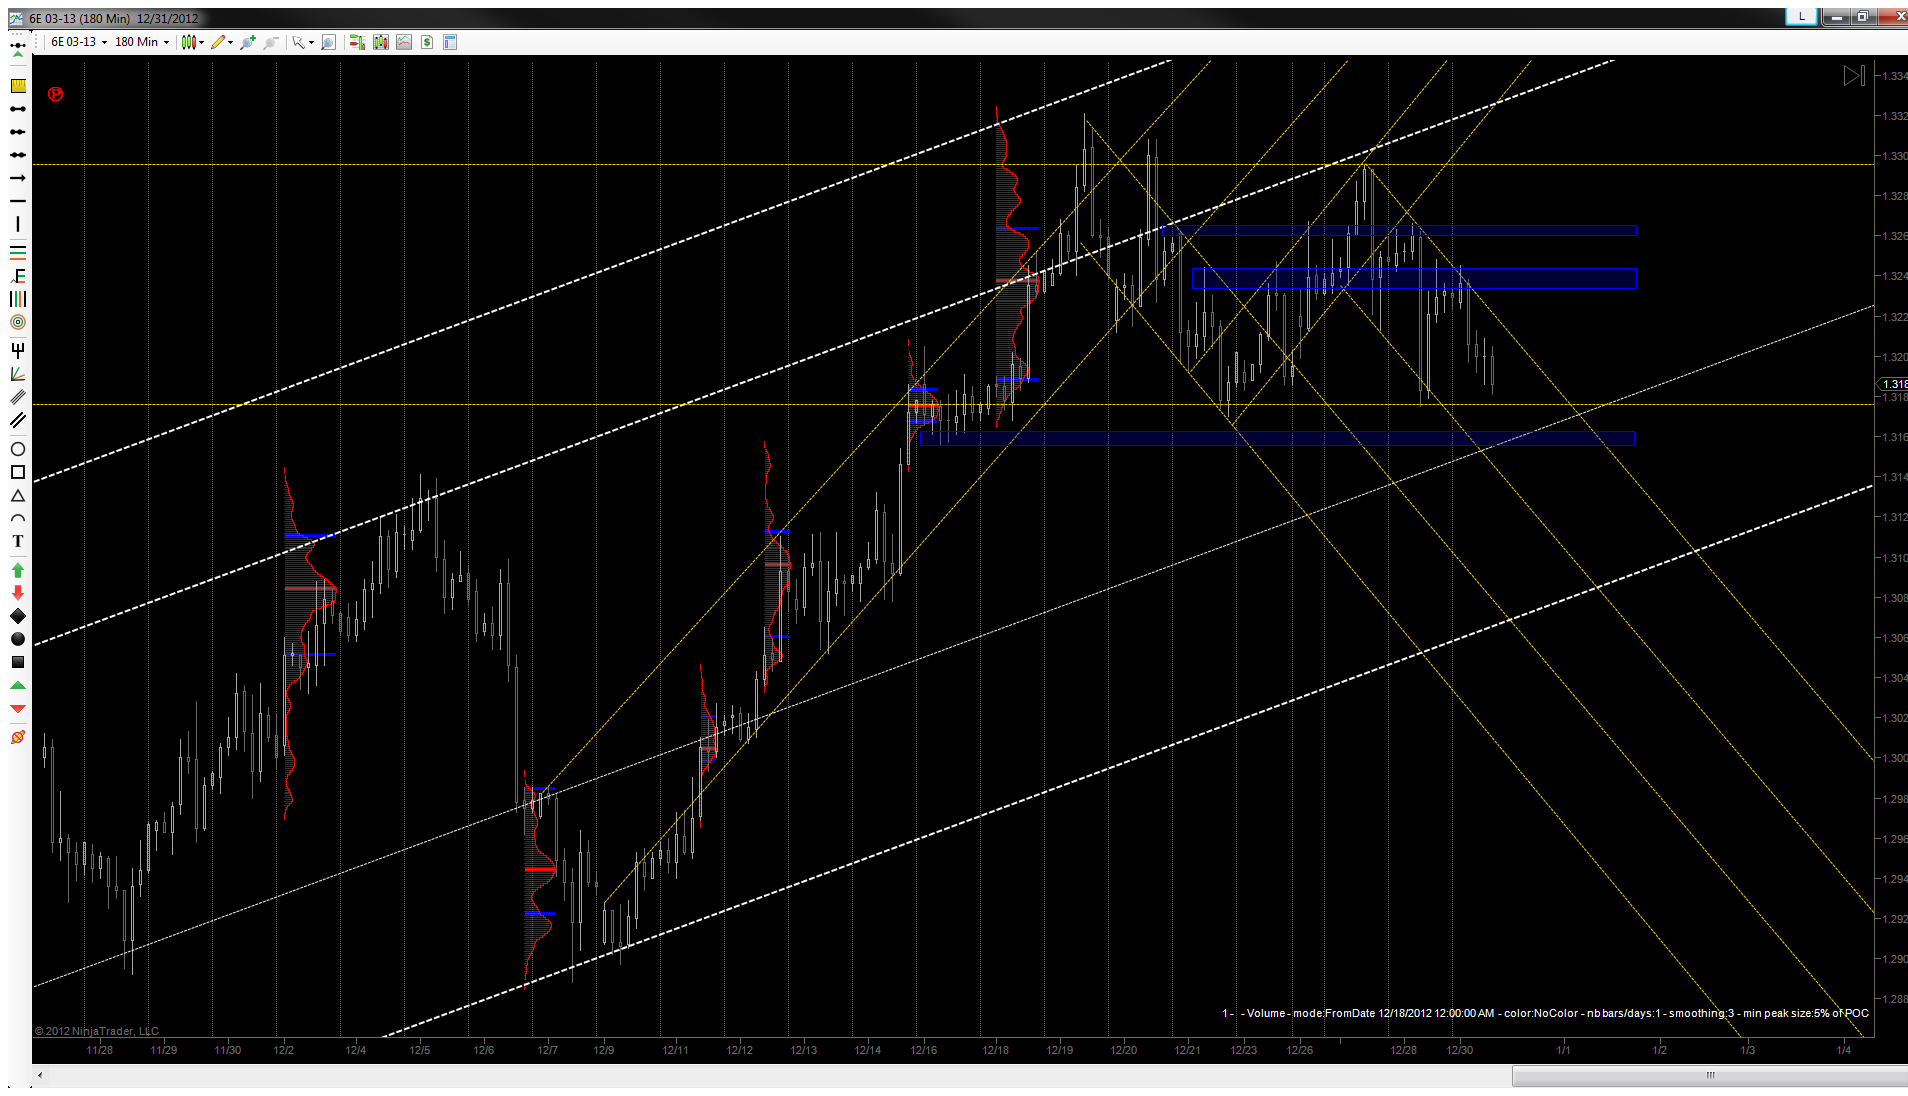
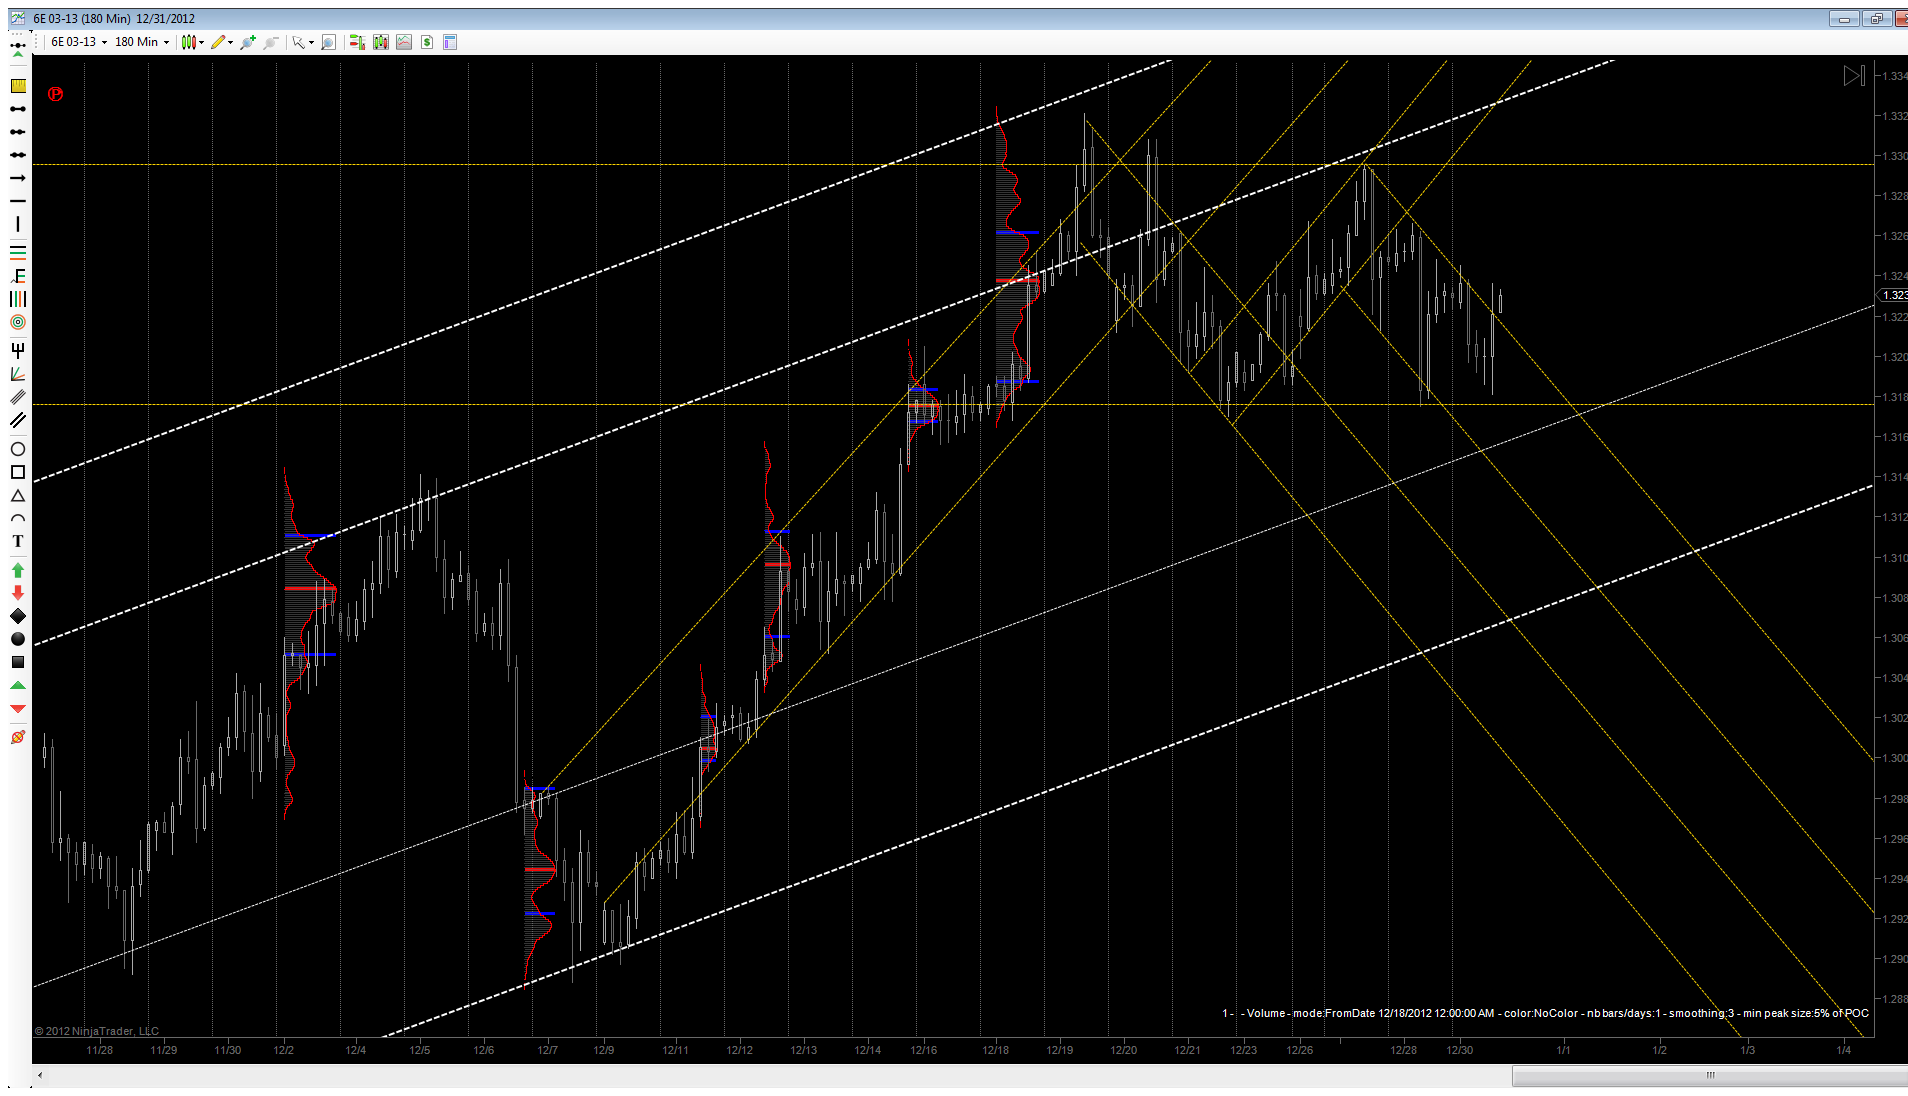
We are in balance right now, and I got yanked around a bit, but still in the green. Don't plan on trading till after the new years, but here is what I see. We have been ranging since 12/18, and I have tried to jump on the swings, only to give most of it back on the reversals. Bad trade management on my end. We have a balanced profile since then, so I would only be looking to trade the extremes. Everything seems to be news fueled lately, so I am expecting a move down if we go over the cliff, with a strong move up if it gets fixed.
Euro set up from 1.3050 to 1.2950.. 2/3 scale out@1.3040 and 1.3030
The approach is to take 3 cars with 20 tick stop, scale 2 out@10/20 ticks and aim for target on last.
Currently sim trading euro.. If I can build 4-6 months of consistent results with a decent profit margin, will consider taking live trades in currencies and holding as long as necessary towards assumed targets..
I'm somewhat new to trading futures currencies but I've been managing myself decently scalping on the 3 min chart while keeping an eye on the DX. I'm wondering, what's the best way to investigate what caused this big spike in demand? I checked forexfactory but there weren't any news events around this time.
What are some things that would typically cause this to happen?
"What are some things that would typically cause this to happen?" Fear and Greed
This topic of "cause" could generate a lot of interest, you could probably make a list in alphabetical order a couple times over. FWIW, I'll throw my two cents in and remind (myself) anything can happen,,, at any time.
Basically, price rises when demand is more desperate than supply. And it rises to a point at which there are no more buyers willing to buy at a higher price.
And price falls when supply is more desperate than demand. And it falls to a point at which there are no more sellers willing to sell at a lower price.
Its not because there are more buyers than sellers. Its because one side is more desperate than the other.
You picked a nice chart to post, that spike in volume was exceptional. Your chart is a good example for anyone new to currency trading as well as more experienced traders why (I believe) it's important to manage risk with working stops when I have an open position in the market. In this example a 4 or 5 tick mental stop could have turned into a 10 or 15 point loss in a few seconds. Today's markets move fast, and often in one direction. These moves can move faster than you can see the price change on a chart, and as your chart shows, with huge amounts of volume. Often when that heavy volume pushes price into new levels, it (price) never comes back.
I marked up a 5 second chart to offer an idea of what happened within the three minute bars on your chart.
This chart shows all the three minute bars for the day, obviously that three minute bar was the highest volume bar of the day. The yellow line in the sub window shows the average volume of a three minute bar, the bar you questioned was more than ten times the average, along with the previous chart it's clear more than half of that volume traded in a ten second period in a 13 tick range. Control your risk, use stops.


 We just broke the 3020 level, so I am hoping it holds. Got some alert lines to wake me up if they are crossed: