Welcome to NexusFi: the best trading community on the planet, with over 150,000 members Sign Up Now for Free
Genuine reviews from real traders, not fake reviews from stealth vendors
Quality education from leading professional traders
We are a friendly, helpful, and positive community
We do not tolerate rude behavior, trolling, or vendors advertising in posts
We are here to help, just let us know what you need
You'll need to register in order to view the content of the threads and start contributing to our community. It's free for basic access, or support us by becoming an Elite Member -- see if you qualify for a discount below.
-- Big Mike, Site Administrator
(If you already have an account, login at the top of the page)
I am not sure if this is what you mean. TOS help desk is excellent plus youtube have about 4-6 videos about TOS
VP etc. There are 3 inputs avaialable- Volume profile, Monkey bars and TPO profile. I am a big fan of Futuretrader71. These charts may not have accuracy to the tick but they work for me. It's interpretation of the data which
matters. I have thought several times about switching to another platform ( data feed etc) to get Volume Profile/TPO etc but have not found any key elements i am missing with TOS.
A friend of mine is really into making sure his data is accurate to the tick. He uses Ninja platform and some high quality data feed provider. The way he does slicing and dicing of data and interprest it is very subjective and
personal to him. For example he has charts with 5 years , 2 years of profile for every product he trades and so on. It takes quite an effort to get this data goining.
He and i day trade together sometimes. It amazes me what little value ( in my opnion) he gets out of his very extensive slicing and dicing of data. Too many levels for my taste. He has been for 10 years and he does not mind
but he agress that he has gone overboard in his quest for getting his data correct to the tick. Once he understood that for example for CL, ADR is 150 ticks. 80% of trading days CL will rotate within ADR from one end to the other.
Having all kinds of levels of this node and that node is confusing at best for day trading and swing trading- he took his foot of the peddle in his quest for drawing perfect charts and focused on trading.
With TOS it takes a second to switch between any product, any time frame etc. and it's always ON. I do agree data has to be correct. I just do not know how bad or far off TOS data is compared to others.
Note: I am not an extensive user of MP/TPO and thus have limited experience compared to other traders.
Some time ago i've rewritten the tos native volume profile study to be able to draw the profile onto custom area.
Actually it's not the panacea and it has some limitations but at least it does the job i want it to do..
Actually there are two scripts....
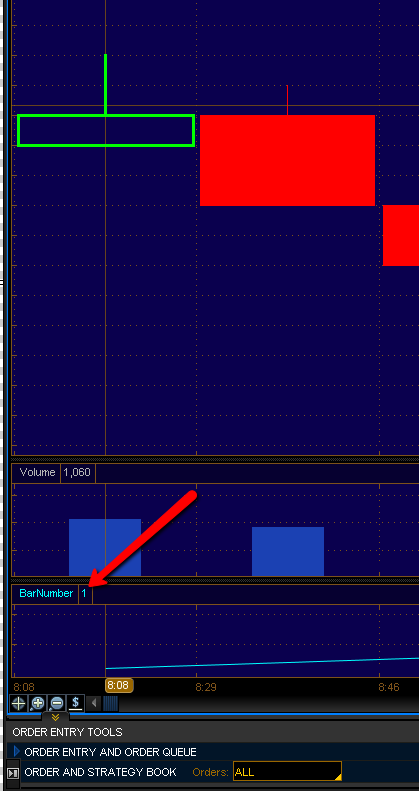
The only way to reference some particular bar is to use it's number. There is Barnumber() function in thinkscript that does count bars on opened chart. The first bar you see on the chart has the number 1 etc....
To visualize theese numbers i've written simple piece of code
Name it Barnumber, save this new study and attach it to your chart. You'll see such picture:
When you move the crosshair and point it on the candle (bar), this study show its number dynamically.
Ok...now we have numbers of each bar..
Copy this code and paste it as a new study. Name it and attach to your chart.
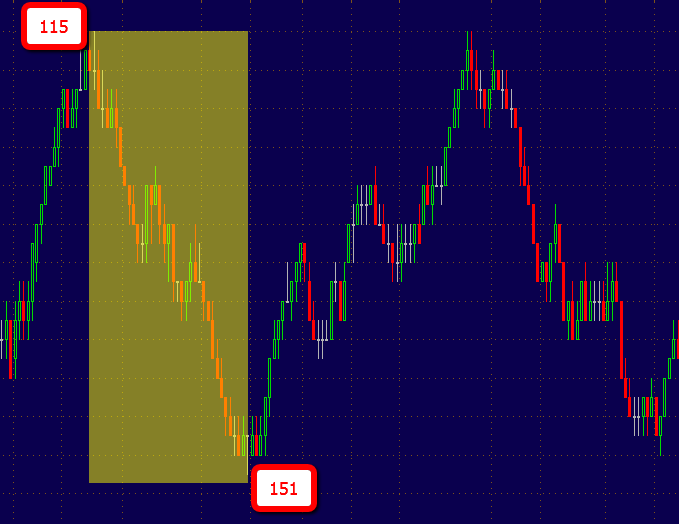
To select custom area of your chart you have to know two numbers - the first bar of your area and the last one.
For example i want to draw volume profile of highlighted leg....At first i remember two numbers of bars 115 for first bar of that area and 151 for the last one.
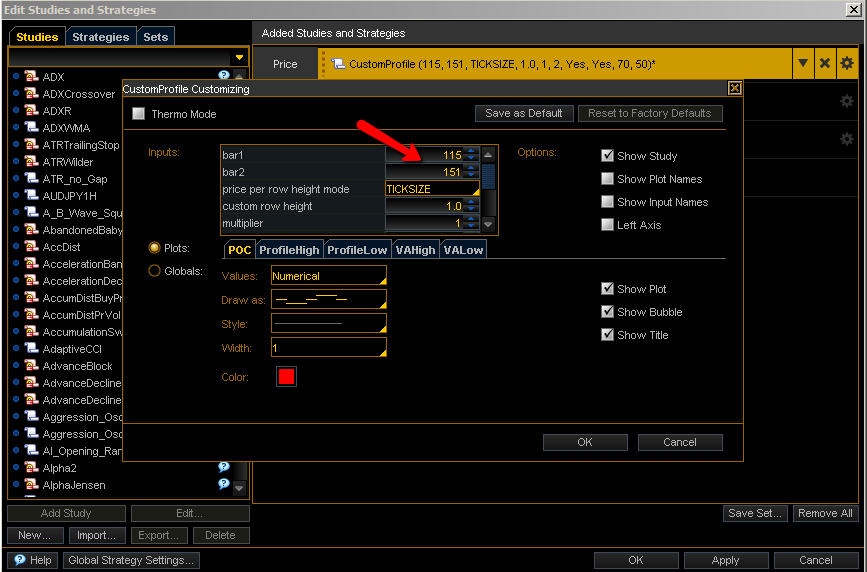
Input this values into bar1 and bar2 settings
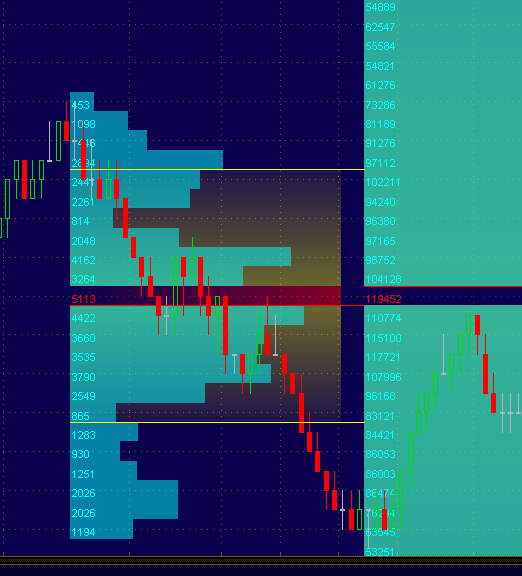
Click OK and now you have the volume profile of choosen area.
Now about its limitations....you can see that there is another profile constructed from bar 151 to current bar....I've tried to get rid of it but it seems like it get worst than this version...so i'm using it as is...
So i hope that guys from thinkorswim team will fix it one day. I've also written alot of requests to tos team of to be able to see the number of bar into info panel instead of adding additional lower window.....
I felt that we needed a thread dedicated to the discussion of Volume Profile.
Some basics, you can hover over these and click on most of them to get more info in the wiki. I also encourage you guys to improve the wiki articles by editing …
In the settings, have you tried "DAY" and "3" for multiplier? I use basic Week, Chart, and DAY settings so not sure if that would work. just a thought.
In the end I have decided to use Sierra for both my swing trading alongside my existing intraday trading. The volume profile capabilities of TOS are unfortunately not adequate for my needs.
However I am planning on opening my swing trading account with TD Ameritrade, so ill use Sierra primarily but it will be nice to have TOS as a back up since they offer it free. TOS has some nice analytics which ill dig into.
TOS is certainly a powerful platform with a lot of great features, so im certainly not knocking it. Their focus is simply not on profiling capabilities which I rely on heavily.
It appears to only work on current day, time frame etc
Disclosure:
In no way am I promoting his website or script service this is FYI only. It is completely up to you if you want to join and for all I know it may be in/ on the free side of his website