Welcome to NexusFi: the best trading community on the planet, with over 200,000 members Sign Up Now for Free
Genuine reviews from real traders, not fake reviews from stealth vendors
Quality education from leading professional traders
We are a friendly, helpful, and positive community
We do not tolerate rude behavior, trolling, or vendors advertising in posts
We are here to help, just let us know what you need
You'll need to register in order to view the content of the threads and start contributing to our community. It's free for basic access, or support us by becoming an Elite Member -- discounts are available after registering.
-- Big Mike, Site Administrator
(If you already have an account, login at the top of the page)
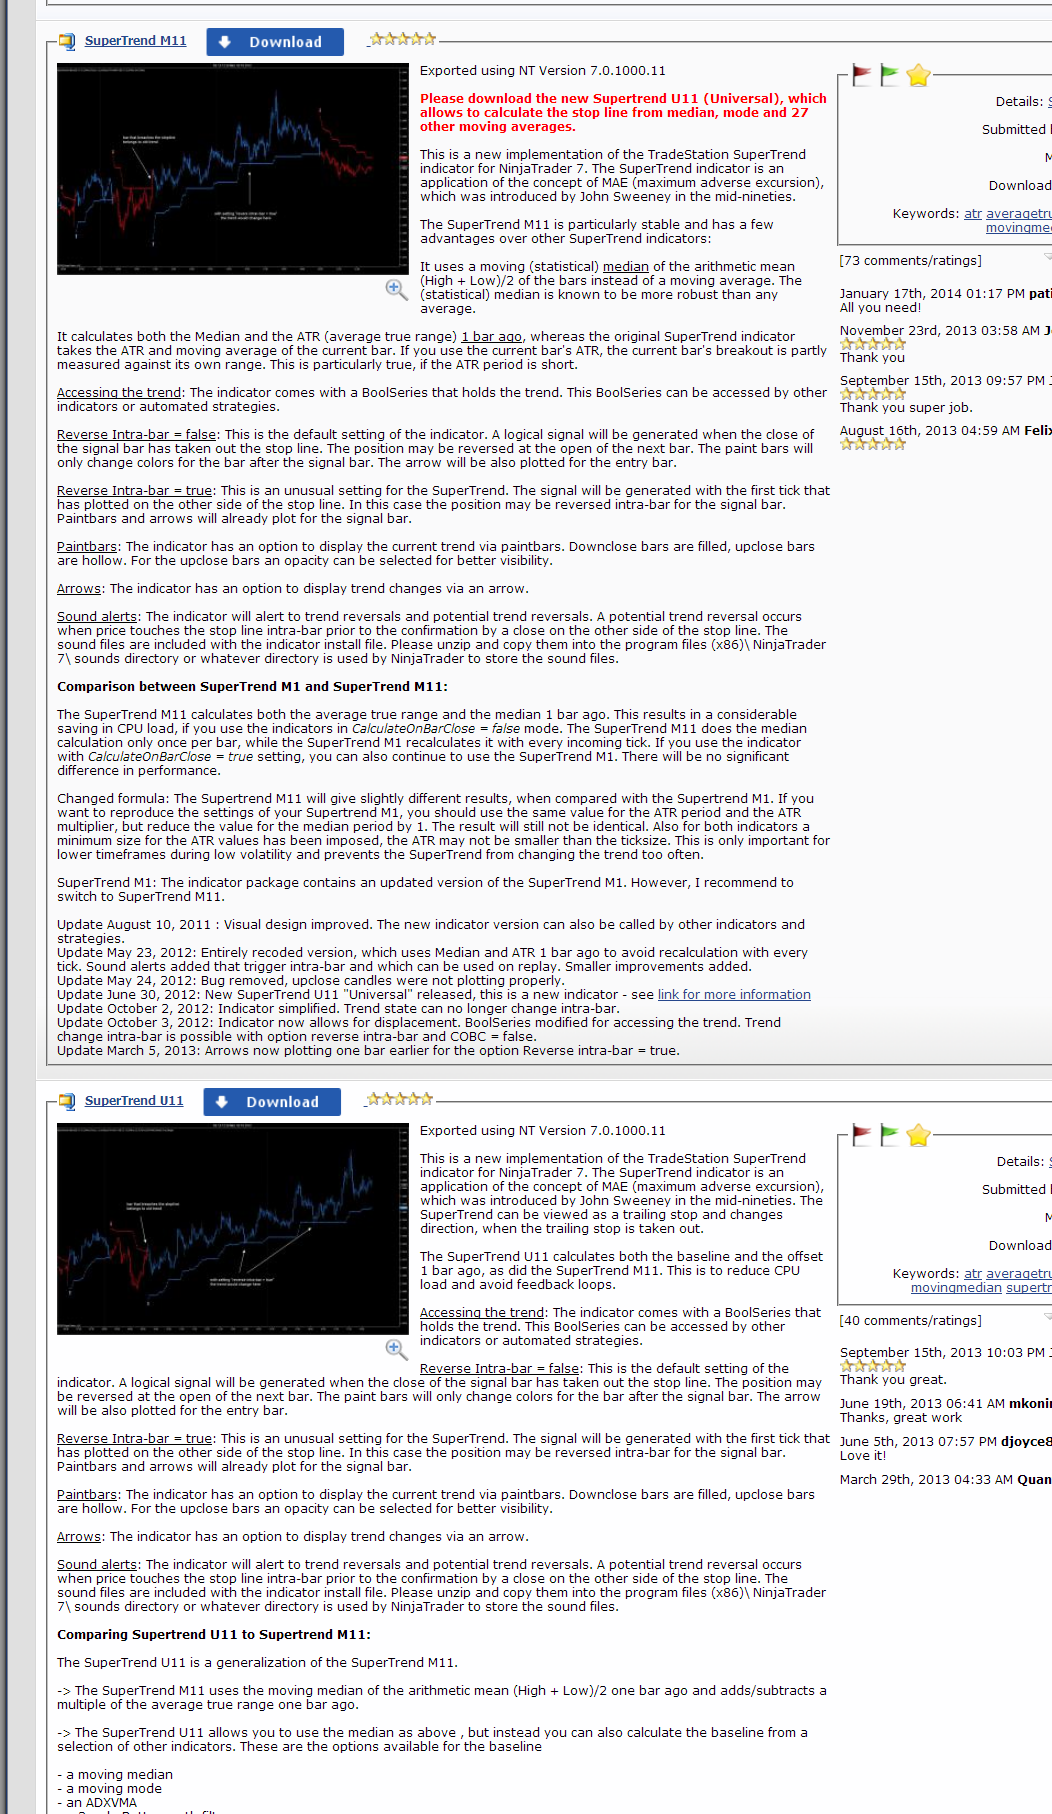
the white line looks like it jumps around similar to a POC (point of control) and the price bars as if they are colored red or green once they extend past a vwap standard deviation band...or maybe the vwap and POC are combined (averaged or weighted) because the line moves a little bit when price doesn't trade in its area. just guessing here, i'm no expert or programmer, lol.
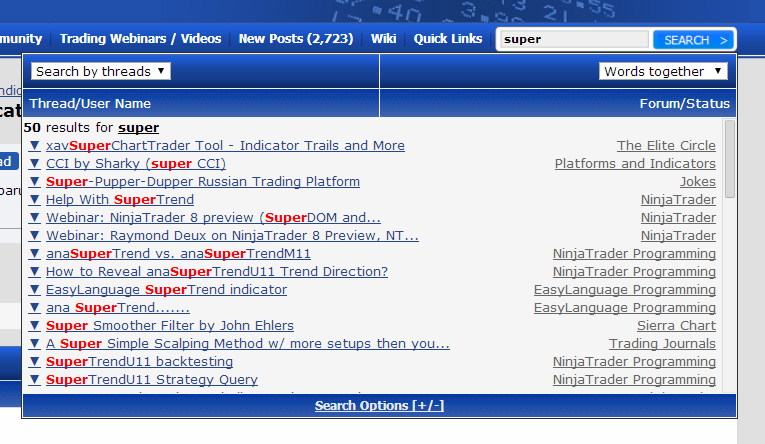
Playing around with anaSuperTrend and some SuperTrend strategies here in this forum, I have noticed that some of these anaSuperTrend versions are a bit different in the plotting and arrow trend signaling.
Would someone be able to tell me the differences …
from the library here:
If those are NOT close enough, use them as a descriptive starting point to explain how they are the same and different from what you might be looking for. Point is just asking and hoping that someone else finds or creates, does not win a great deal of interest in the nexusfi.com (formerly BMT) community.
Begging a guy with whom you do not have any rapport is also a non-starter in most cases. Two other suggestions would be show the effort that you are taking to solve your own issue and consider joining the community as an elite member.
@paruchuriphani: The white line indicator looks like a Chandelier Stop, which is switched off, when volatility drops beyond a selected limit. In that case it plots a horizontal line.
I cannot easily reproduce it, also I do not have a data feed for the Nifty Magic.