Welcome to NexusFi: the best trading community on the planet, with over 150,000 members Sign Up Now for Free
Genuine reviews from real traders, not fake reviews from stealth vendors
Quality education from leading professional traders
We are a friendly, helpful, and positive community
We do not tolerate rude behavior, trolling, or vendors advertising in posts
We are here to help, just let us know what you need
You'll need to register in order to view the content of the threads and start contributing to our community. It's free for basic access, or support us by becoming an Elite Member -- see if you qualify for a discount below.
-- Big Mike, Site Administrator
(If you already have an account, login at the top of the page)
There is no way of including daily bars. Due to a NinjaTrader limitation the loading of daily bars will not work properly depending on the selecting session template. So the daily bars maybe inserted both too early or too late.
The only reliable way of inserting daily bars, would be
(1) in case that you need the settlement price for futures : loading them asynchronously as for the SessionPivot and FibonacciZones indicators
(2) in case that you do not need the settlement price for futures: building them from intraday data
If you need daily bars you should use a different indicator. I understand what you need, but there is no way of including this option with NinjaTrader 7. Maybe with NinjaTrader 8, if the bug is fixed, but then you will have to wait for a few years.
Below is the updated install file for the NewVisualEMA and NewVisualSMA. I consider this still to be version for testing, the indicators are not yet final.
Please uninstall the first test version prior to installing this file.
I had to make quite a number of changes relating to
-> NinjaTrader processing bars of primary and secondary bar series with identical time stamps
-> eight different options for transition from historical to real-time data
-> modifications of the code to adapt to session breaks
@madLyfe, @perryg: Please let me know, if you find any bugs!
-> if you show the entire chart
-> leave the indicator settings on top of the chart, allowing me to test it on my side
-> also let me know, whether it is historical or real-time data
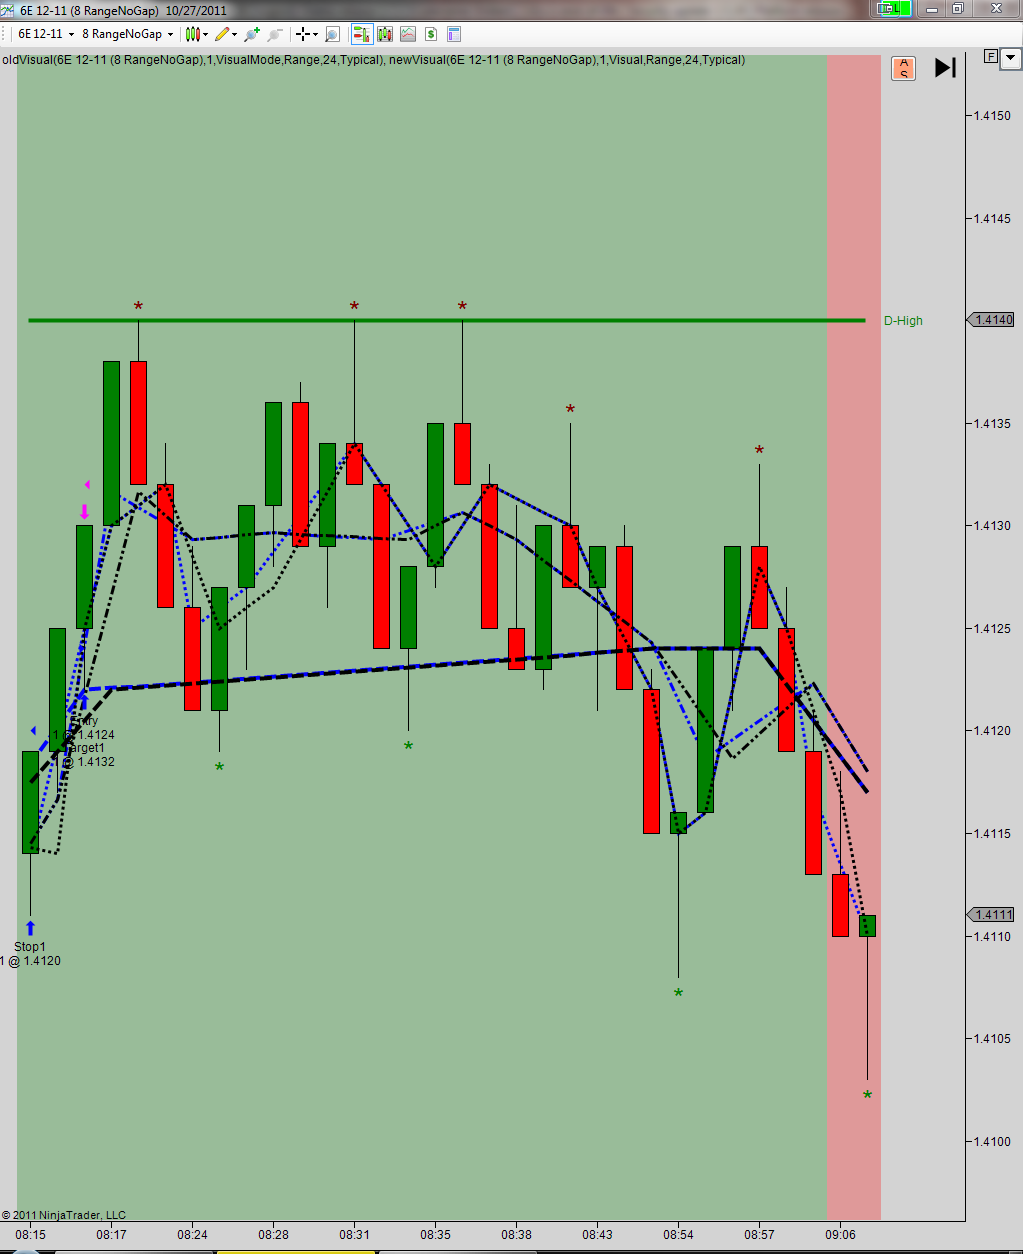
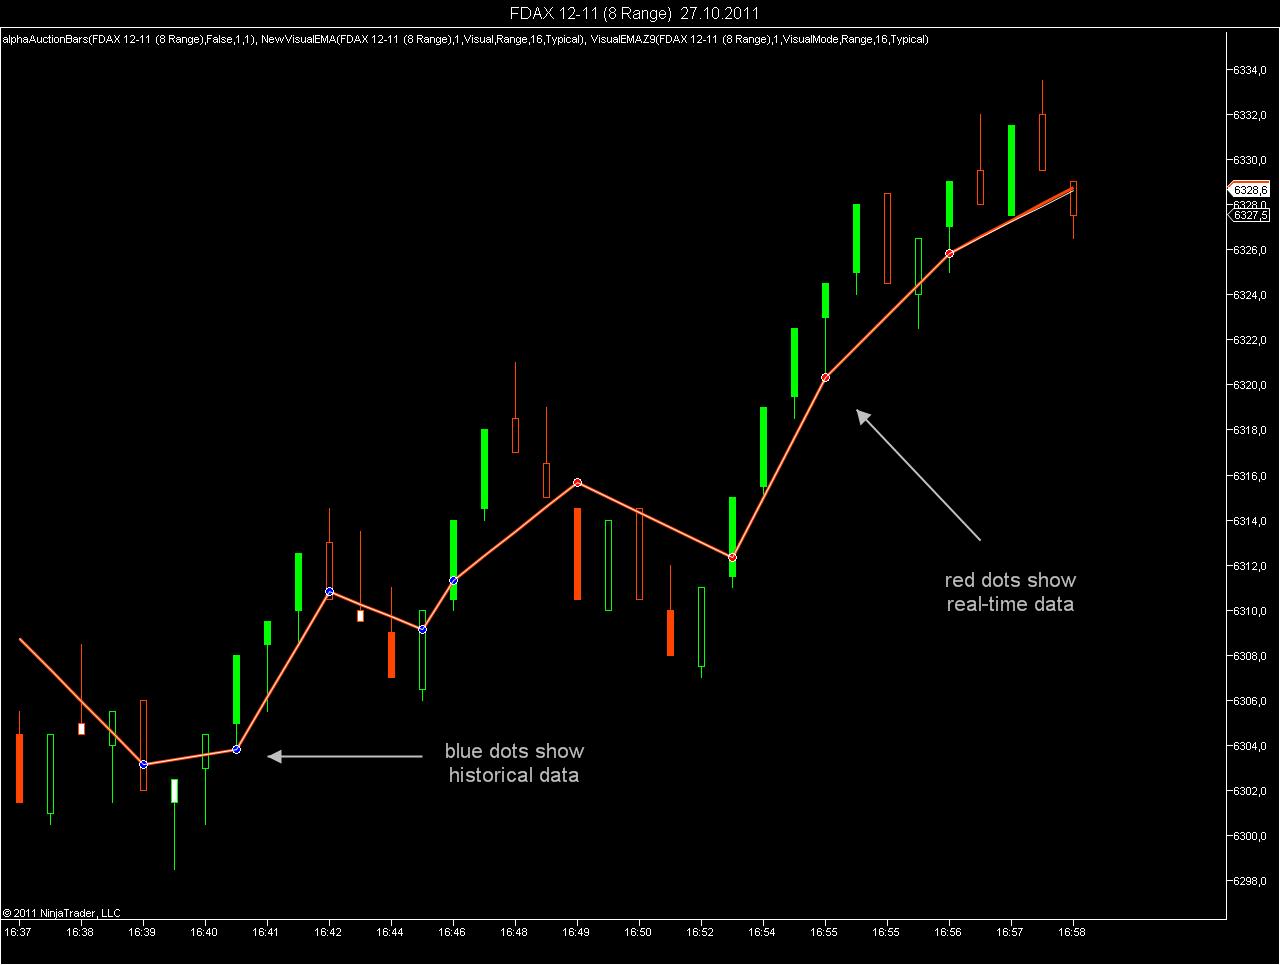
I do not have 8 range no gap bars installed, so I can only run it on a range chart. I am now running it in real time against the old indicator and will post the result in a few minutes. I have also modified the test indicators to show whether they have detected historical data (blue dots) or real-time data (red dots). This makes it easier to find out what happens.
The modified indicator with the dots added and one additional minor change relating to the first real-time tick, when a minute bar series is loaded, is attached below:
But in a first step I want to test the indicators on default bars. I have had problems with some Renko bar types which were not correctly coded in a way that some indicator did not run.
In a second step I may test the indicators on exotic bar types to find out whether they are compatible or not. They have now been tested on second, minute, volume, tick, range and Renko bars. This took already hours, because Ninjatrader processes bars in a different way on charts built from ticks and those built from seconds or minutes.
An approach that I have been using is to not tie the secondary series to a defined time, range, etc but instead to define it based on multiples of the primary data series. I believe this has been referred to as composite bars.
So, on any type of chart, the 2x "extended" time frame would simply look back twice as far as the base indicator, etc. This is not necessarily as simple as it seems. Sometimes when looking back twice as far you need to skip every other data point. Or when looking back three times as far, only look at one of every three of the previous data points. Otherwise all you are doing is doubling or tripling the lookback period in the base time frame. Except for indicators like the stochastic that are looking for highest highs and lowest lows.


 dont believe anything you hear and only half of what you see