Welcome to NexusFi: the best trading community on the planet, with over 150,000 members Sign Up Now for Free
Genuine reviews from real traders, not fake reviews from stealth vendors
Quality education from leading professional traders
We are a friendly, helpful, and positive community
We do not tolerate rude behavior, trolling, or vendors advertising in posts
We are here to help, just let us know what you need
You'll need to register in order to view the content of the threads and start contributing to our community. It's free for basic access, or support us by becoming an Elite Member -- see if you qualify for a discount below.
-- Big Mike, Site Administrator
(If you already have an account, login at the top of the page)
I have coded a whole series of those indicators. Example below is the MACD. It is based on composite bars. I have not published it yet, because I still want to modify to take into account "rolling composite bars", for example if I have a 15 minute chart and a timeframe factor of 4, I could calculate the indicator values from the series of hourly bars shifted by 5 minutes, when the minute bars plots for 00:05.
Chart below shows the MACD calculated from composite bars, that is it displays the values for a 60 minute MACD on a 15 min chart.
Not any type of chart. It will work on minute, tick and volume charts, as a 100 tick bar can be built from two 50 tick bars, but what about range bars? You cannot build an 8-range bar from two 4-range bars, because typically they overlap.
I have solved this issue by using the proportionality between range and the square root of time. You can effectively build an 8-range bar from 2 * 2 = 4 of those 4-range bars. The resulting indicators will run smoother than the original indicator that runs on an 8-range bar.
There will be no dots on the final version of the indicator, because the drawing all those dots is unnecessary and slows down NinjaTrader. Currently I just use the dots to mark the data as historical or real-time. Blue dots detect historical data, red dots real-time data.
I have tested the NewVisual Indicators during the week end, and indeed in some cases the new indicator is not lagging any more. The last old version had compensated the lag, in case that the primary bars were identical with the secondary bar type loaded. The new version will also compensate the lag for different bar types, so there is indeed some improvement.
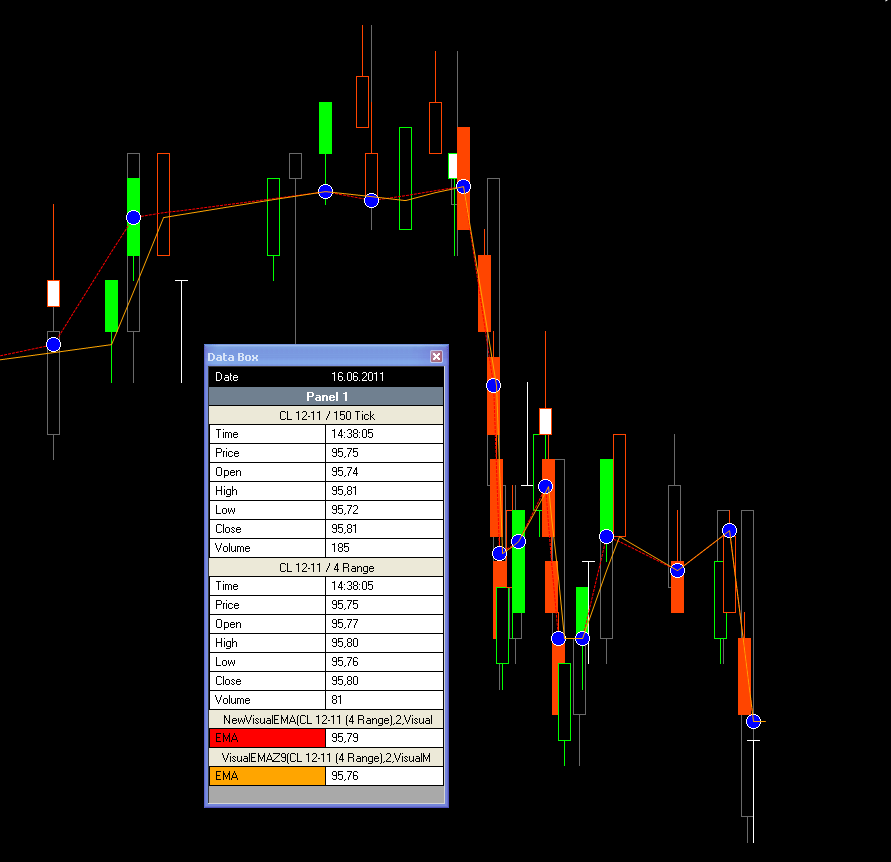
The chart below shows a range chart (primary bars, green and red) and secondary tick bars (control series in gray although not required by the indicator). The old indicator (orange) when calculating values from tick bars and plotting them to a range chart did indeed show a lag. while the new indicator (red) compensates for that lag.
The data box shows that the range bar and the tick bar have an identical time stamp at 14:38:05. The new indicator already uses the indicator value from that tick bar and displays it simultaneously for that range bar, while the old indicator lags one bar behind.
Here comes the next test version. There was a minor bug which affected the interpolation in visual mode directly after the session begin. On a non-equidistant chart the interpolation algorithm needs to substract the duration of the session break from the interpolation interval, which was omitted. It is now corrected.
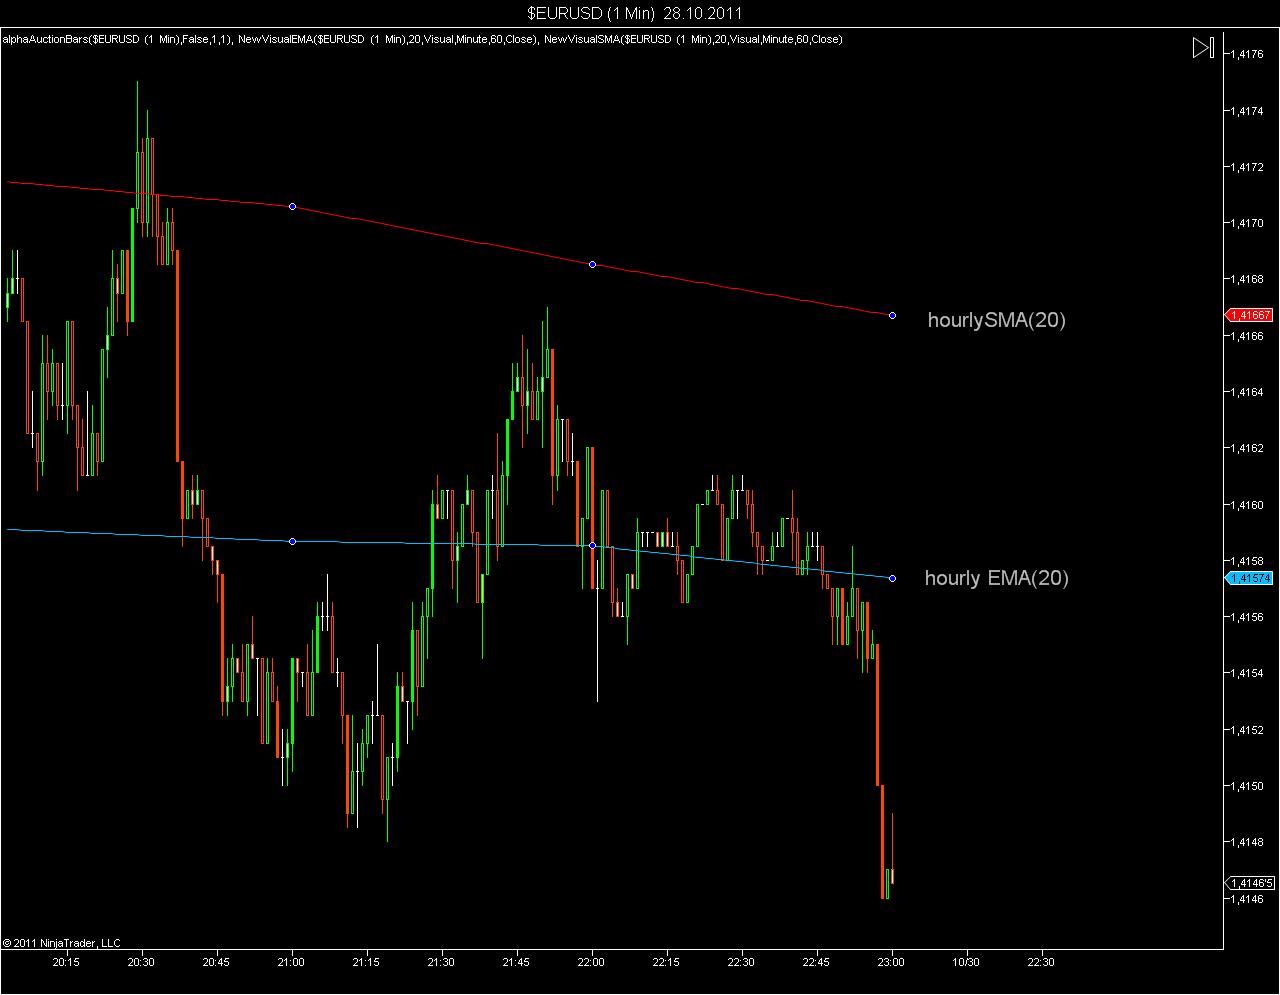
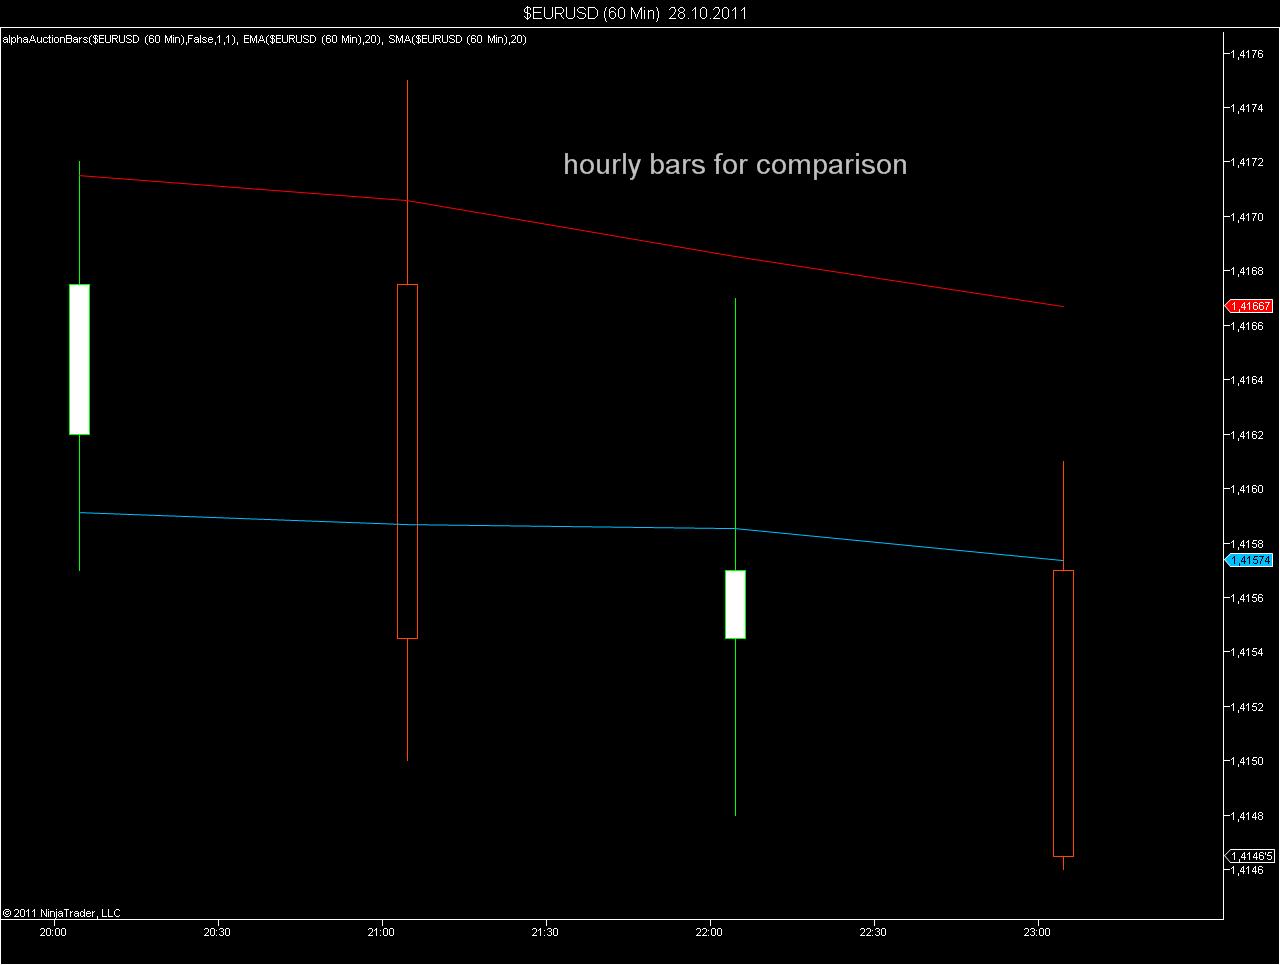
I am very satisfied with the stability and performance of the new version. I just displayed an hourly 20-period EMA on a 1-minute chart with a lookback period of 365 days. These were the loading times:
old version of the indicator : 2 minutes and 10 seconds
new version of the indicator : 7 seconds
There is a significant performance gain, due to simplification. As shown in the post above the new version also produces a smaller lag than the old version. The indicator is slowly leaving its adolescence.
The latest test version of the indicator is attached below
I suppose that you got that message, when you tried to save the template. I think that there is a NinjaTrader bug, which occasionaly hits and causes problems with the serialization. Best solution is to shutdown NinjaTrader and to restart it again.
If this does not help, please let me know what exactly you did to produce this message.
If anybody else has made the same observation, please let me also know.
I still heavily use your original version it does take a while to load but works like a charm once its up and running so a quicker load time got me interested in trying your new version. I imported the new one and it works great. I was just wondering if you could make it so you can select those dots on or off. I find they clutter up the screen a bit. Thanks for all the hard work on these indies!
The dots will disappear or be selectable in the final version. I have forced them now, because they tell me whether a chart that is posted uses historical or real-time data. The dots are just required for the testing process.


 It will work on minute, tick and volume charts, as a 100 tick bar can be built from two 50 tick bars, but what about