Welcome to NexusFi: the best trading community on the planet, with over 150,000 members Sign Up Now for Free
Genuine reviews from real traders, not fake reviews from stealth vendors
Quality education from leading professional traders
We are a friendly, helpful, and positive community
We do not tolerate rude behavior, trolling, or vendors advertising in posts
We are here to help, just let us know what you need
You'll need to register in order to view the content of the threads and start contributing to our community. It's free for basic access, or support us by becoming an Elite Member -- see if you qualify for a discount below.
-- Big Mike, Site Administrator
(If you already have an account, login at the top of the page)
The posted code is just an example, an idea how it can be done. I like "drunken sailor" very funny, however let me post some charts.
Here is the setup:
On the left side we have 15min chart with regular EMA 12, 30min EMA 12, 60min EMA12 and 60min SMA20
On the right side we have 4tick Better Renko chart with VisualEMA 12period 15min(orange), 30min(Aqua Blue) 60min(Dark blue) and Visual SMA20 60min(White)
VisualEMA and VisualSMA are thicker 2pixel lines, MY code (NOT the one posted) are the 1 pixel thinner line same colors.
only 15min are set to 'Calculate on bar close = false' the rest is set to 'true'
VisualEMA and VisualSMA just lags and gives us wrong results.
My code (thinner line same color) match with charts on the left side.
Can you help answer these questions from other members on NexusFi?
Your chart does not show anything, even the indicator settings cannot be seen.
The VisualSMA has three different modes:
VisualMode: No lag mode for discretionary trading.
One-Tick-Correction Mode: No lag mode for discretionary trading, step function.
StrategyMode: The strategy mode is designed for historical data (backtest) and has no lag on historical data.
There is a trade-off. The strategy mode will lag on real-time data just after the transition from historical data to real-time data. This cannot be easily changed. It can be explained by the fact that both SMA and EMA use a recursive formula.
Otherwise there is no lag (meaning the minimum lag between the close of the secondary bar and the close of the next primary bar).
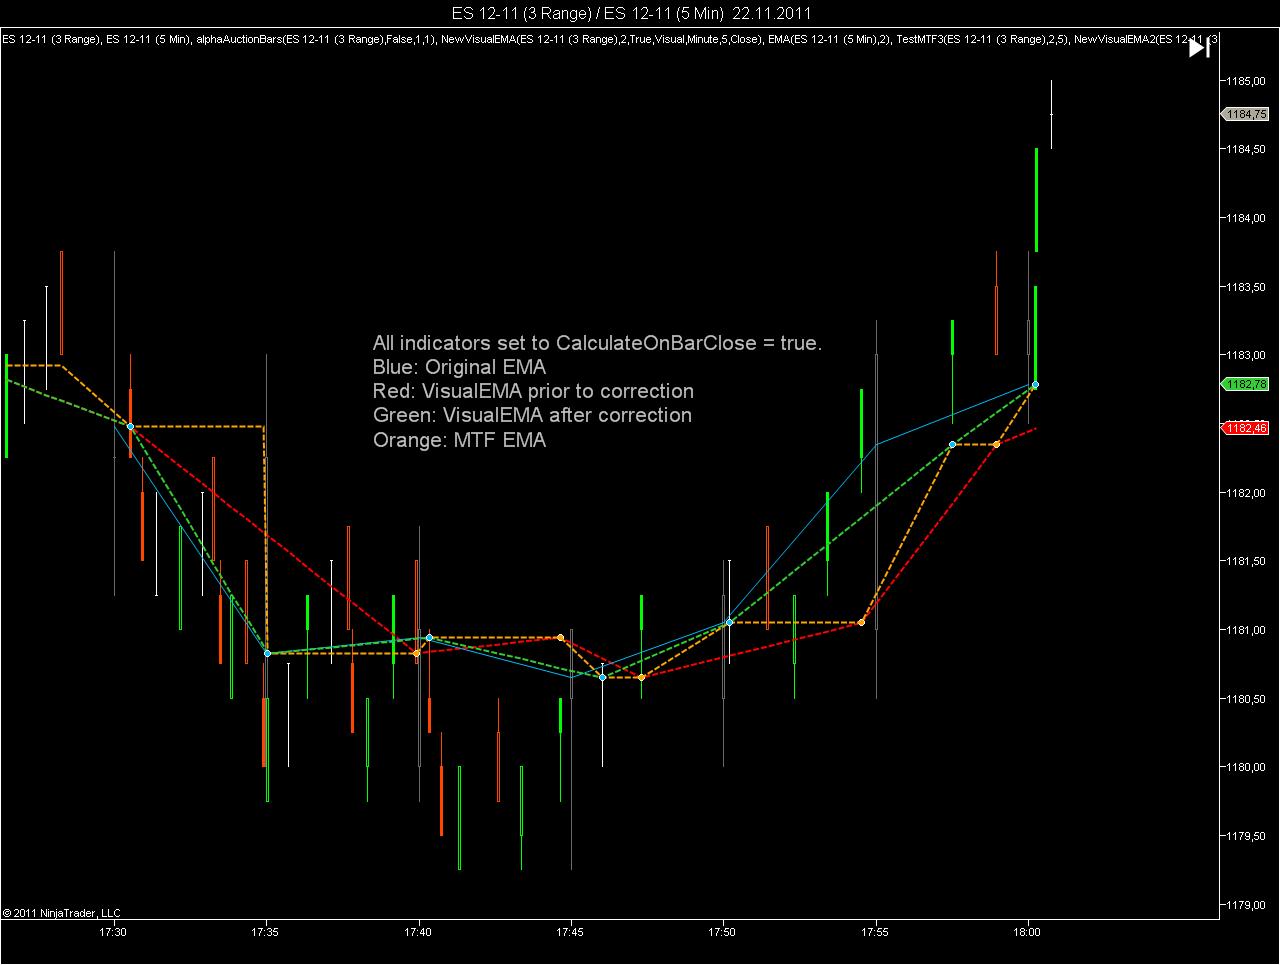
Below chart showing the original EMA directly applied to a 5 min bar series (gray bars) and the VisualEMA (red), which tracks the original EMA as close as possible, given that it can only show the values via the primary bar series. The simple MTF EMA repeats its drunken sailor performance.
@grofzr: I have further tested the VisualSMA and VisualEMA in mode CalculateOnBarClose = true. Although I could not see it on your chart, you are absolutely right.
The indicators lag, when they are set to CalculateOnBarClose = true. Thanks again for pointing this out.
Actually I had never tested them thoroughly in CalculateOnBarClose = true, as I was happy that they worked well tick by tick, when CalculateOnBarClose = false. The correction is not difficult to do, so I will update the indicators today or tomorrow.
The change will have no impact on the way the indicators display on historical data or in mode CalculateOnBarClose = false.
Below is a chart which shows two bar series, 3-range bars (colored) and 5-minute bars (gray). The chart uses non-equidistant bar spacing, because there are two data series. The 5-minute bars have only been added for controlling the multi-timeframe indicators.
On the chart you can see
-> the default NinjaTrader EMA directly applied to the 5-min bars (blue) - this is the benchmark
-> the VisualEMA prior to correction in CalculateOnBarClose = true mode, which lags (red)
-> the VisualEMA after correction in CalculateOnBarClose = true mode (green), which closely follows the EMA
-> the MTF EMA, which lags on historical data, and oscillates between the two versions of the VisualEMA on real-time data (orange)
First kudos to you for all your work on many great indicators. Yes, the main problem was on Calculate on Bar Close = true. I'd suggest you to do testing on 15, 30 and 60 minutes, because I've noticed the biggest differences there. I use code other than posted for my testing. For some reason 5 minutes has given almost identical results on both code(Visual EMA and my test code).You can see 5minute VisualEMA on my charts colored Ivory. I'll try post more charts later.
As was discovered by @grofzr, both indicators were lagging when set to CalculateOnBarClose = true. I admit that the original design of the indicators was adapted to CalculateOnBarClose = false setting, which is more difficult, so I somehow neglected this part.
Testing everything is near-impossible. You add range bars to volume bars, then there is a session break, although the indicator works on historical data and on real-time data, it may have a problem with the transition as NinjaTrader builds a hybrid bar from historical and real-time tick in a non-reproducible manner, there is the possibility of CalculateOnBarClose = false setting or CalculateOnBarClose = true setting, there are technical breaks to be considered where there is no data, as the NinjaTrader heuristics for a trading day does not allow to exclude those session breaks via a session template. Let us say it is sort of a large headache until it works.
I have now tested the updated versions with CalculateOnBarClose = true setting, and so far they passed the test.
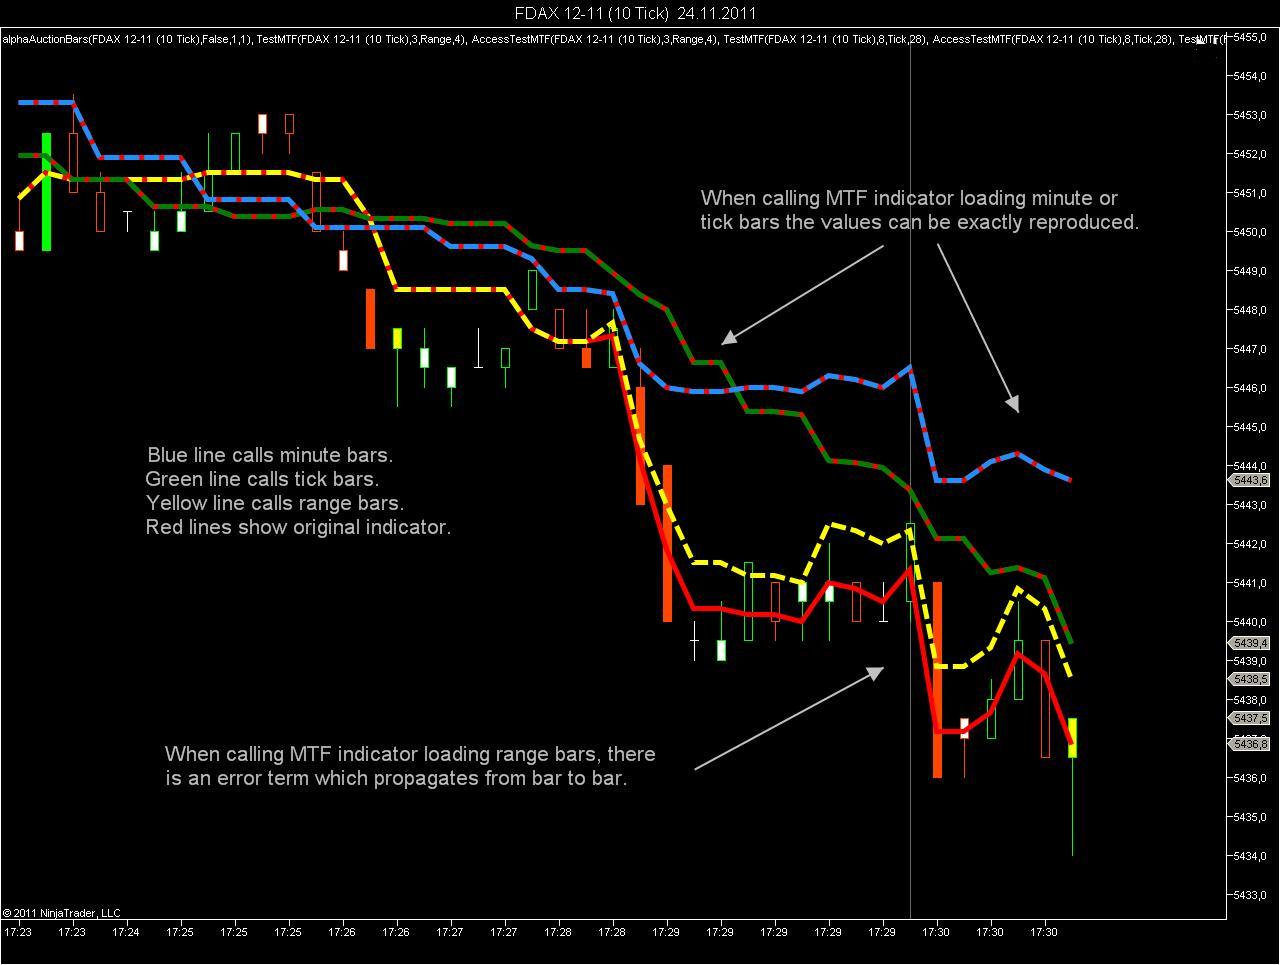
I have made some tests with various multi-timeframe indicators, how they behave when they are called from other indicators or strategies. Let us consider three different cases:
(1) You have a multi-timeframe indicator which loads minute bars.
(2) You have a multi-timeframe indicator which loads tick bars.
(3) You have a multi-timeframe indicator which loads range bars.
Now let us proceed to perform a test. We open any chart (no importance) and first add the original MTF indicator. Then we also add the second indicator, which is calling the MTF indicator to retrieve its values. Both indicators are in CalculateOnBarClose = true and should display identical values for the indicator.
In cases (1) and (2) this works as expected. However, if you try (3) to access an indicator which loads range bars to calculate indicator values, the result is negative. The values transmitted to the calling indicator lag, and there is a growing error term between the original indicator and the indicator which accesses it.
Conclusion
You cannot access any MTF indicator built from range bars via another indicator or strategy in real.time. You can only use the original indicator. However it seems, that there are no deviations on historical data, so I am confident that you can access the MTF indicator for a backtest, but I am not sure.
I believe that the problem is related to the way range bars are built. The range bar is only completed with the first tick of the next bar, which is required to confirm its completion. This probably introduces a lag of one tick between the original indcator and the calling indicator. The gaps once created propagates to the next bar because of the recursive formula of the SMA, which was used.
If you want to reproduce the issue, I have attached two very basic indicators just for documenting it. You can test it on your machine. One indicator is a simple MTF indicator, the other one accesses it and should display the same value.