Welcome to NexusFi: the best trading community on the planet, with over 200,000 members Sign Up Now for Free
Genuine reviews from real traders, not fake reviews from stealth vendors
Quality education from leading professional traders
We are a friendly, helpful, and positive community
We do not tolerate rude behavior, trolling, or vendors advertising in posts
We are here to help, just let us know what you need
You'll need to register in order to view the content of the threads and start contributing to our community. It's free for basic access, or support us by becoming an Elite Member -- discounts are available after registering.
-- Big Mike, Site Administrator
(If you already have an account, login at the top of the page)
If the rolling VWAP is correctly coded this should be possible. It is now 11:15 AM EST. A rolling weekly VWAP just shows the volume-weighted average price of all transactions that occured during a rolling window of 5 business day, that is from Monday, February 2, 11:15 AM EST until Monday February 9, 11:15 AM EST. You can use an algorithm that calculates the average price directly from the volume bars, or the indicator can load a secondary bar series of minute bars / tick bars and use the secondary bar series for calculating the average price.
Build 1230 of Sierra changed the "continuous non-resetting" mode to be what is supposed to be a "Rolling VWAP".
However, I'm having a lot of trouble and the output doesn't make sense to me.
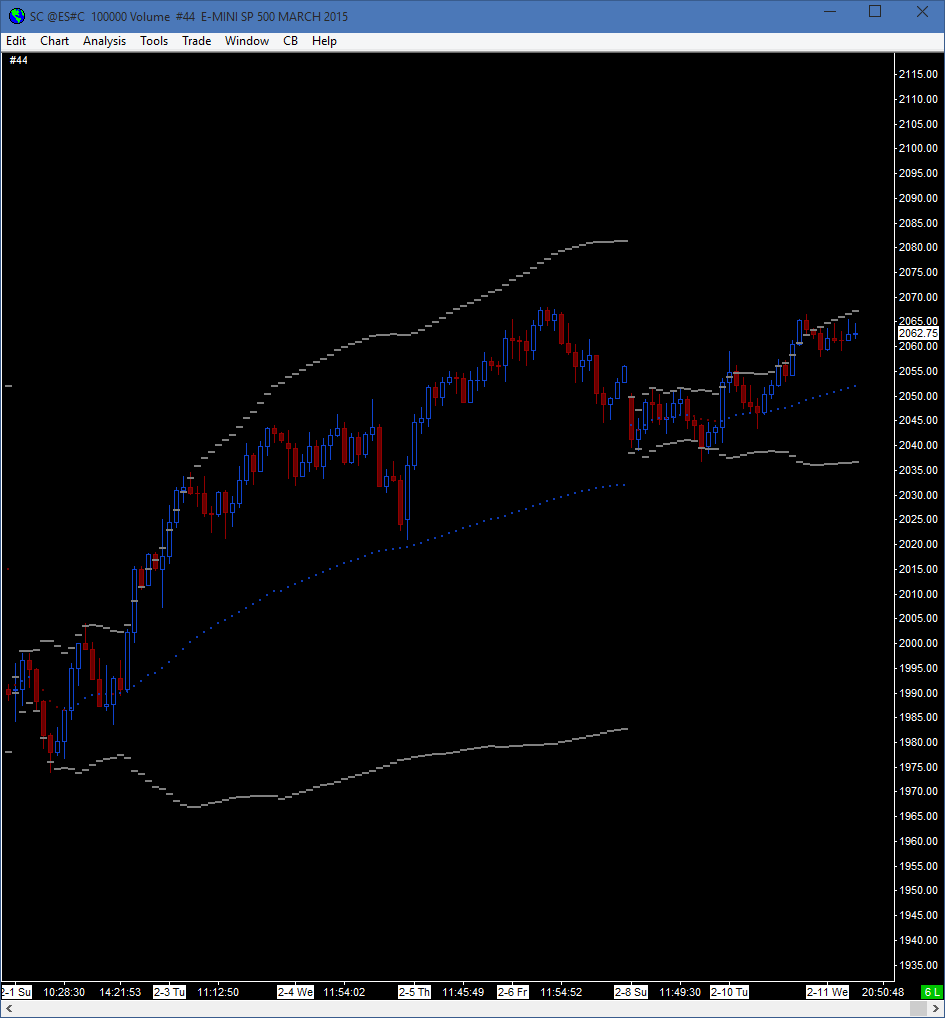
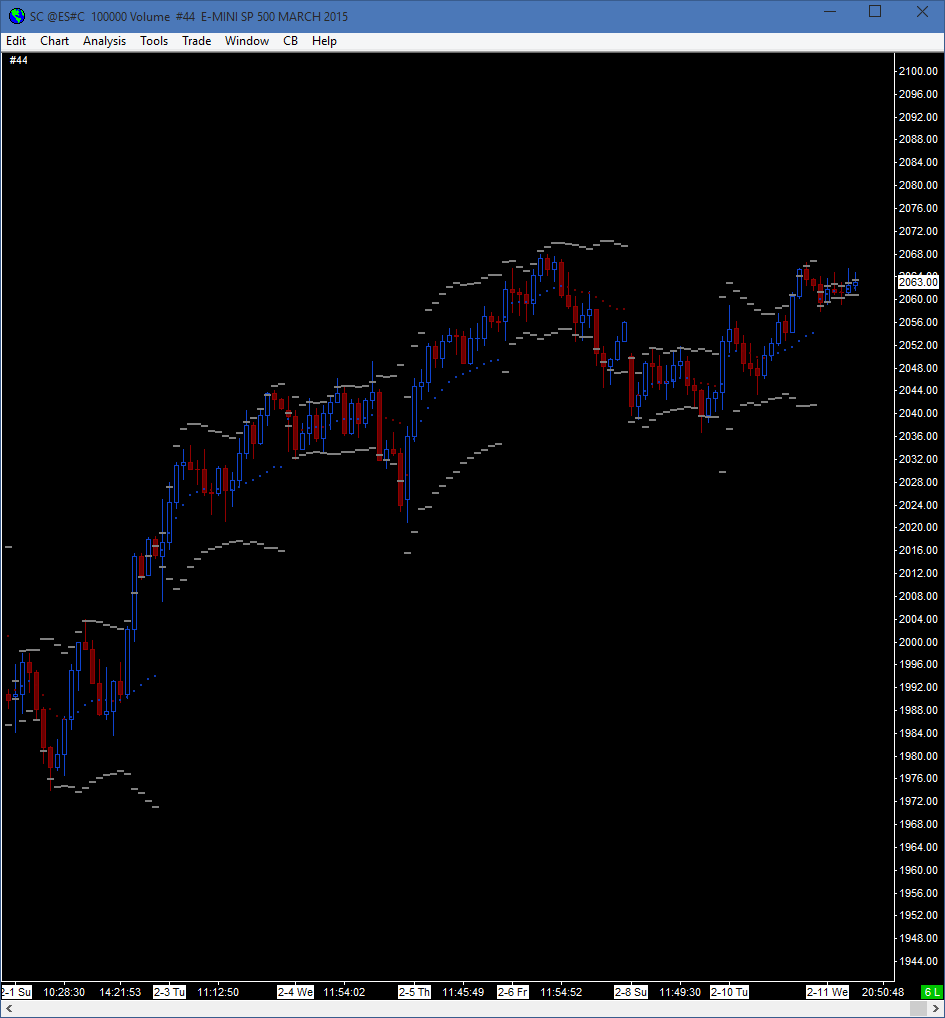
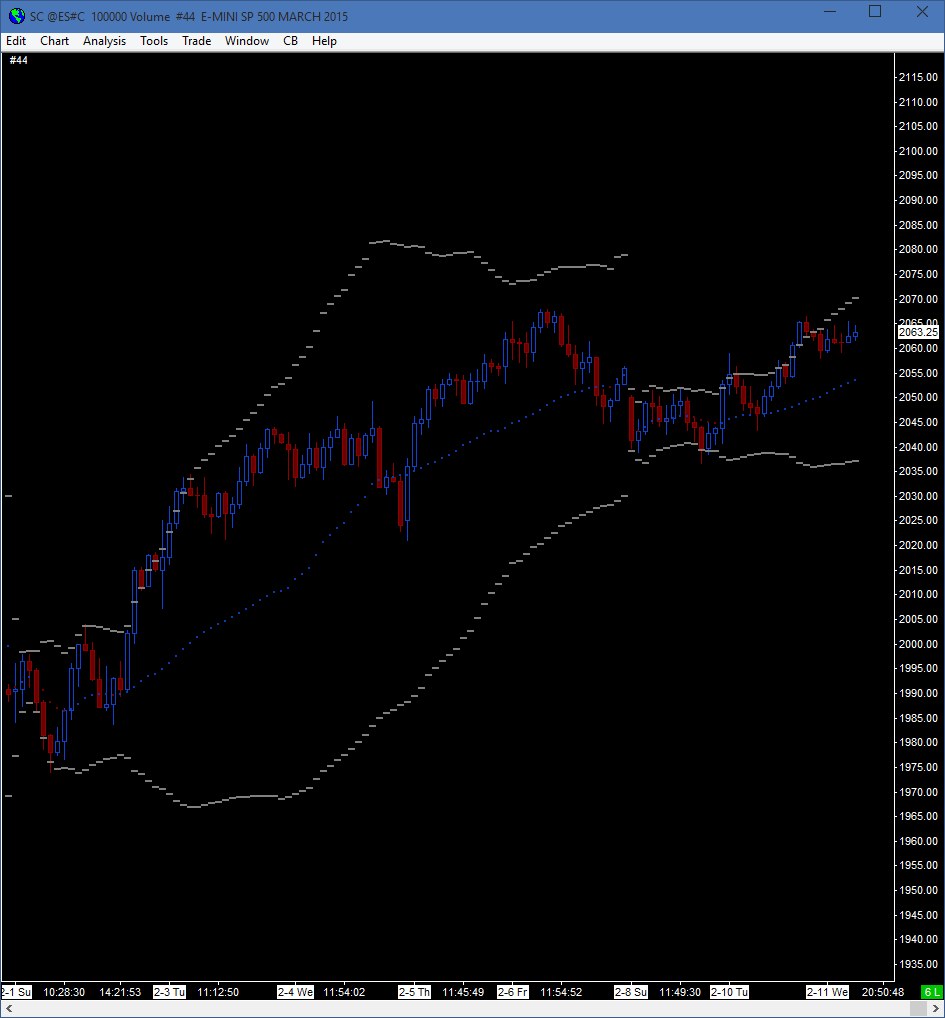
I no longer have NT installed. Can someone that has NinjaTrader as well as Sierra Chart do a comparison of @Fat Tails rolling vwap indicator alongside the Sierra version for the same instrument settings? In particular, please use a non-time based chart (ie a volume chart, or range chart) and make it span more than one week.
Sierra seems to think their implementation is accurate, and they are usually right. It just seems like it is wrong to me, so I'm looking for other opinions.
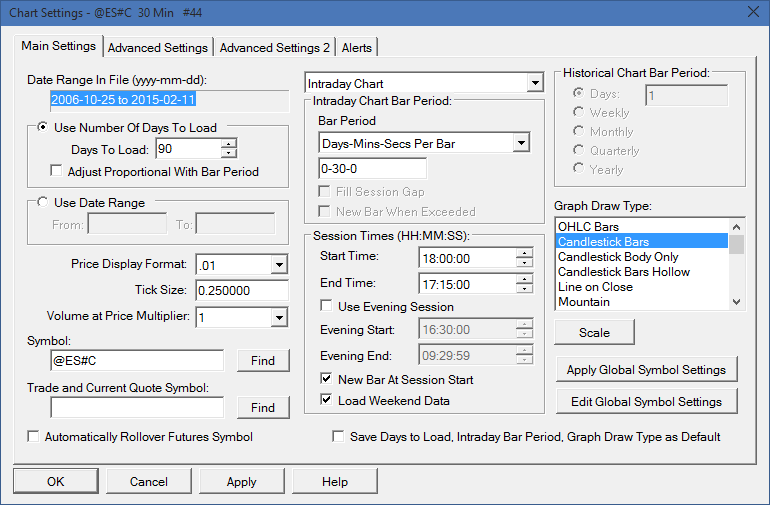
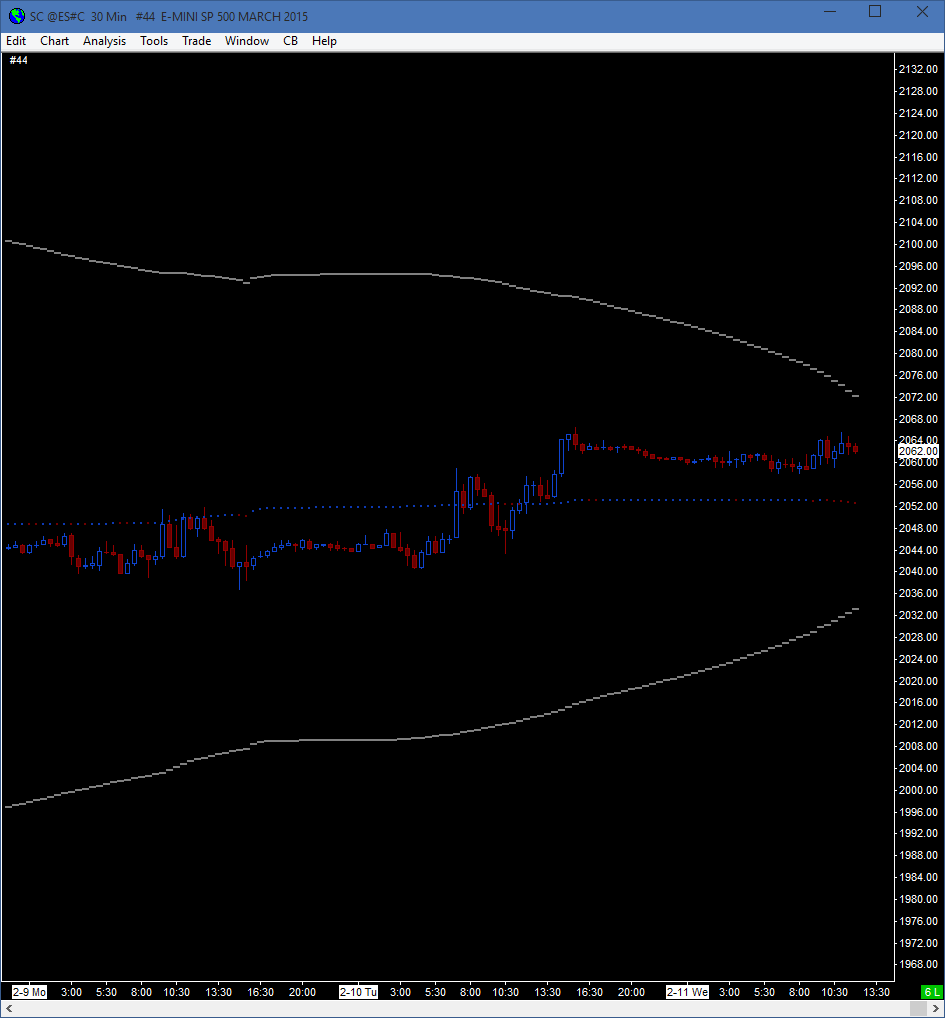
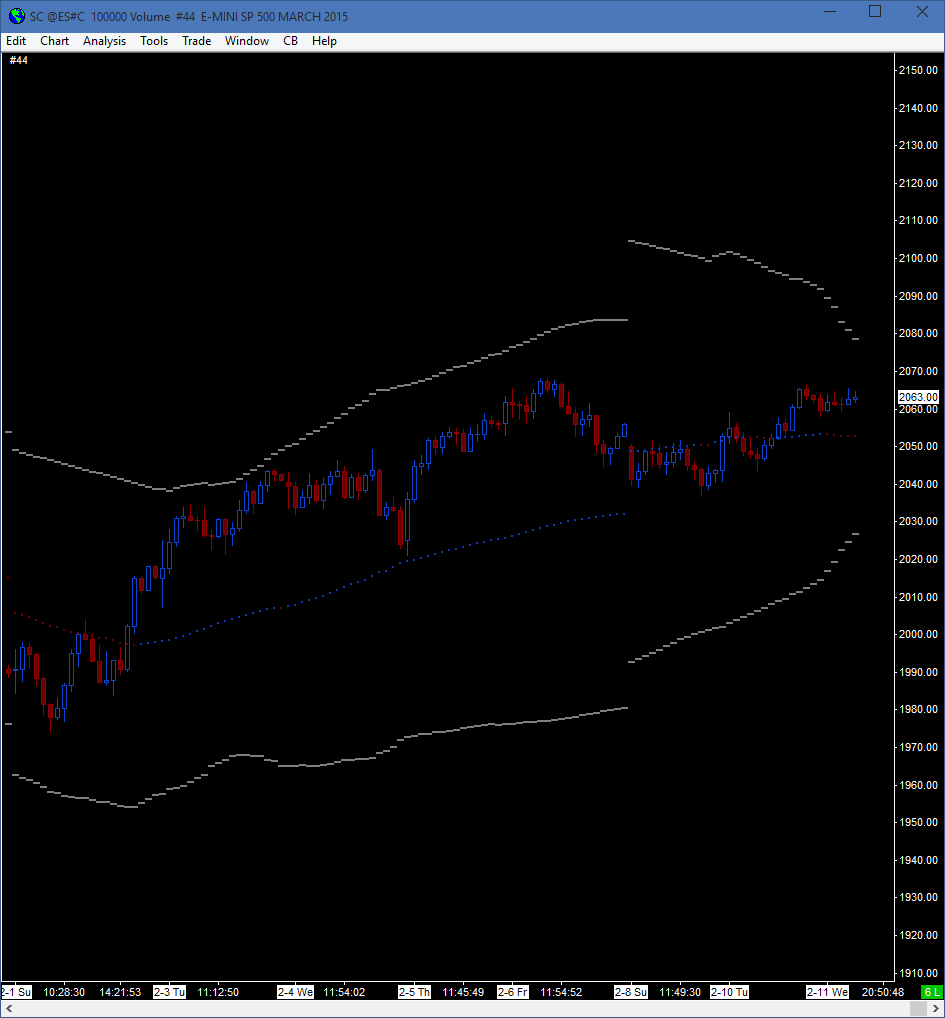
@Big Mike: Could you please post a 30-min or 60-min chart for a common futures contract created with SierraChart and explain why it does not look right?
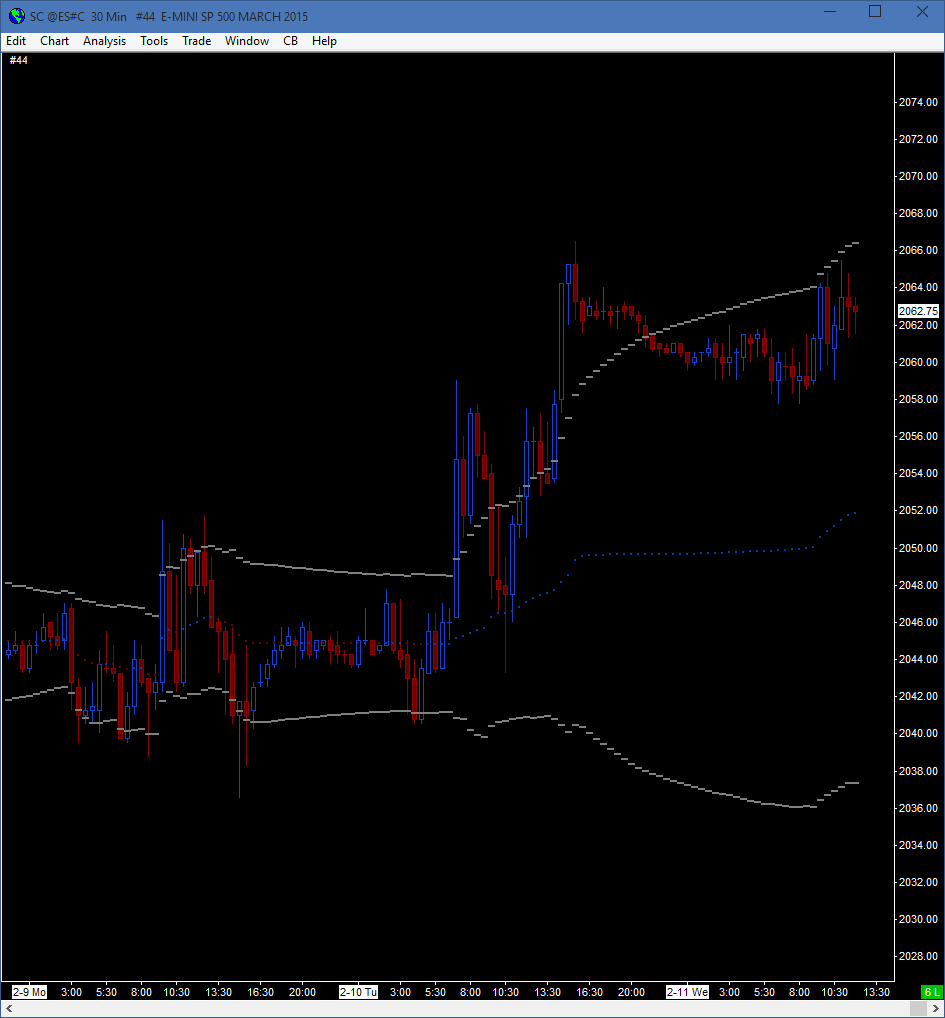
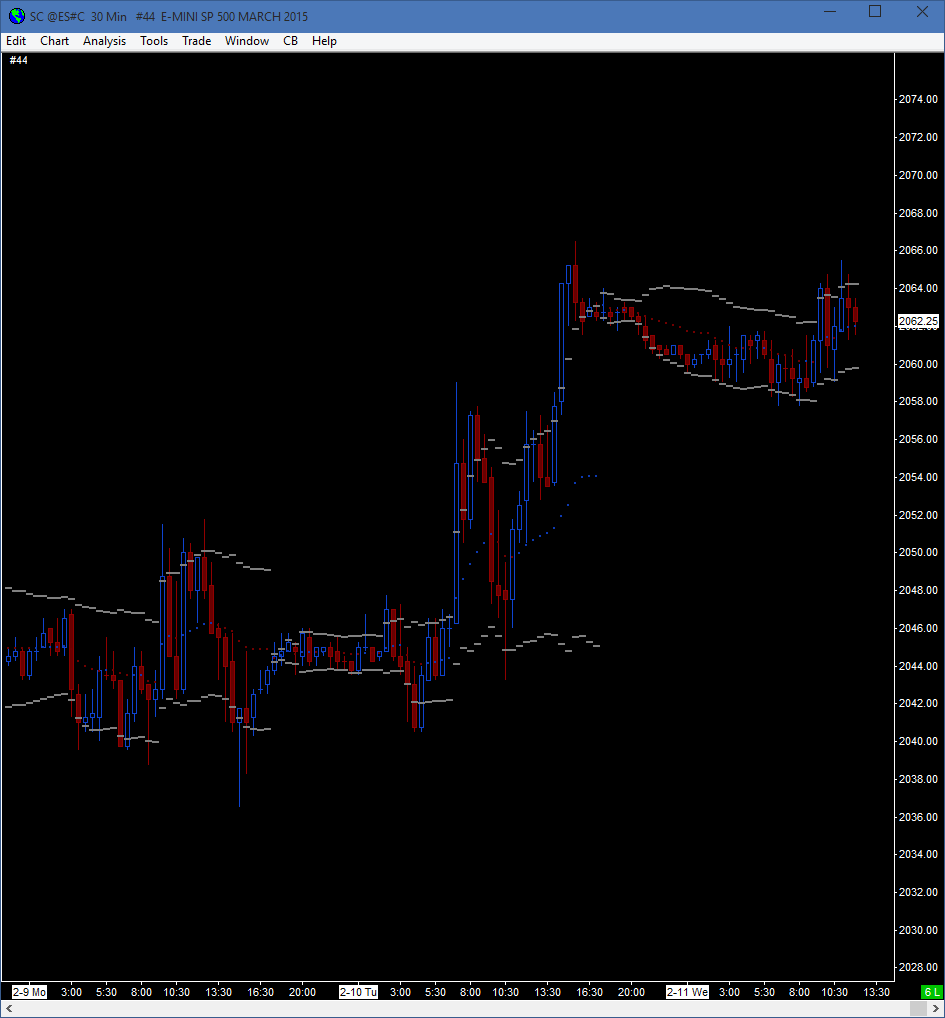
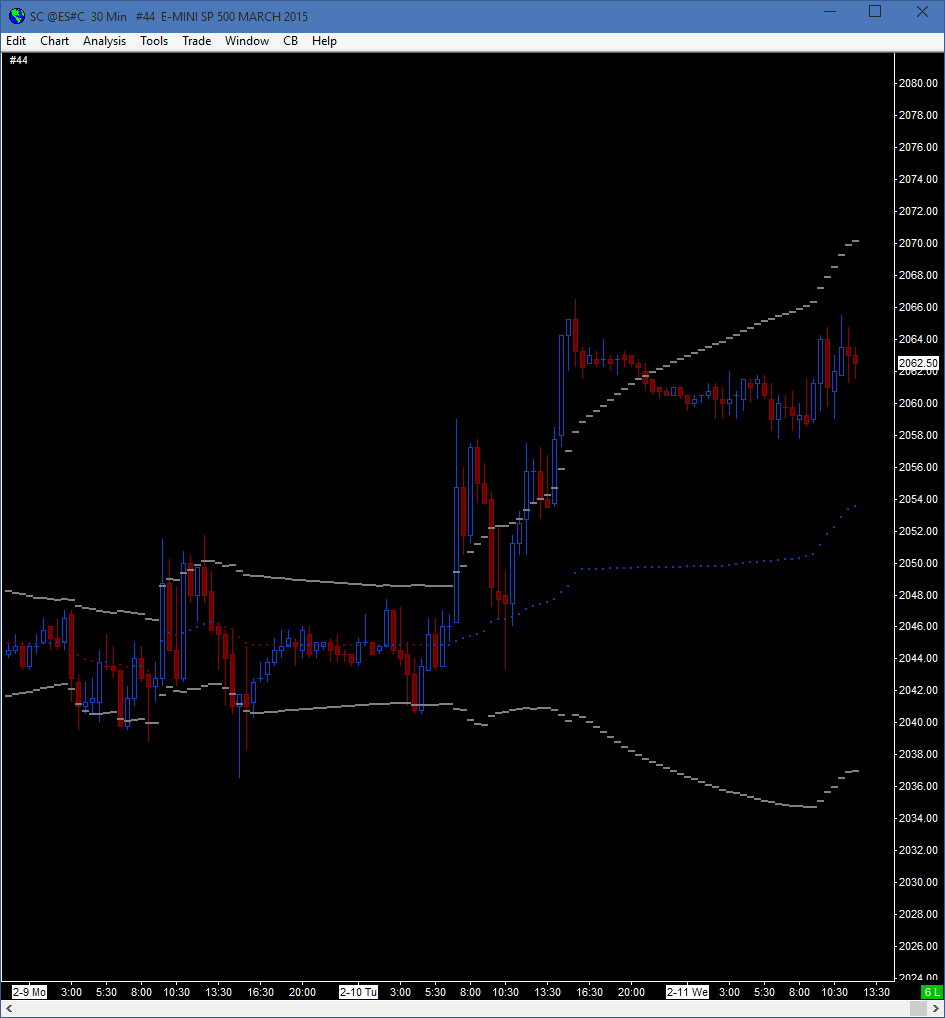
I will post the same chart with my rolling VWAP for comparison.
The 1- week VWAP itself (center line) looks correct. The standard deviation bands do not look correct. How can the standard deviation increase that fast, when only low volume is added during the night session? Maybe Sierra Chart have used a formula for the standard deviation that does not take into account volume. Such as standard deviation does not reflect the real (statistical) standard deviation of all trades during the week.
This is also a weakness of Bollinger Bands. Neither the moving average nor the standard deviation bands are representative for the trades that took place over the lookback period. Bollinger Bands are just a tool for retail traders, which should not be used.