Welcome to NexusFi: the best trading community on the planet, with over 150,000 members Sign Up Now for Free
Genuine reviews from real traders, not fake reviews from stealth vendors
Quality education from leading professional traders
We are a friendly, helpful, and positive community
We do not tolerate rude behavior, trolling, or vendors advertising in posts
We are here to help, just let us know what you need
You'll need to register in order to view the content of the threads and start contributing to our community. It's free for basic access, or support us by becoming an Elite Member -- see if you qualify for a discount below.
-- Big Mike, Site Administrator
(If you already have an account, login at the top of the page)
I use a setting of 10....for all timeframes....it catches most (a) (b)and (c) swings...just have to watch out for false patterns before swing (c) occurs...then just reverse the trade
Well, actually, I've been using it for a while and recommending others use it. What I have been doing of late is this:
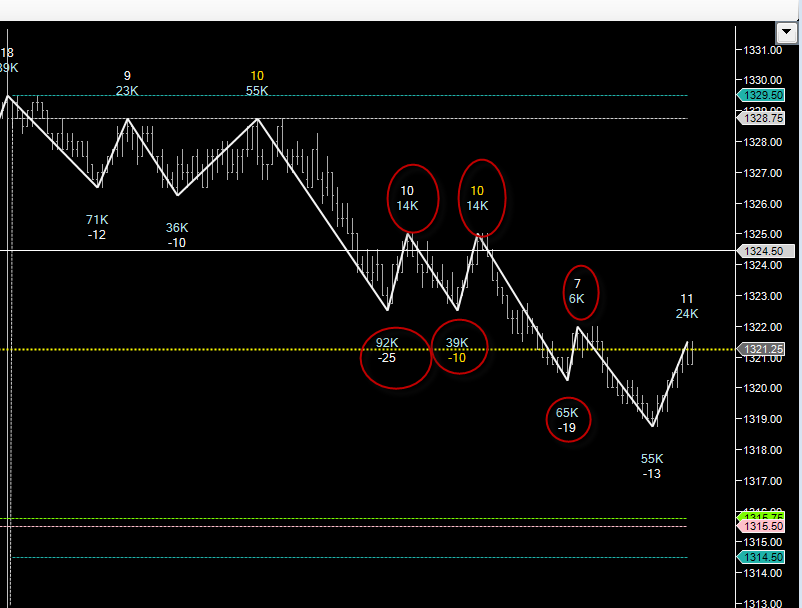
See the volume on the swings I've circled. This is something I never thought of using and it is quite interesting to watch. Certainly in terms of distinguishing those pullbacks that are more driven by lack of liquidity than opposing market orders coming in in volume.
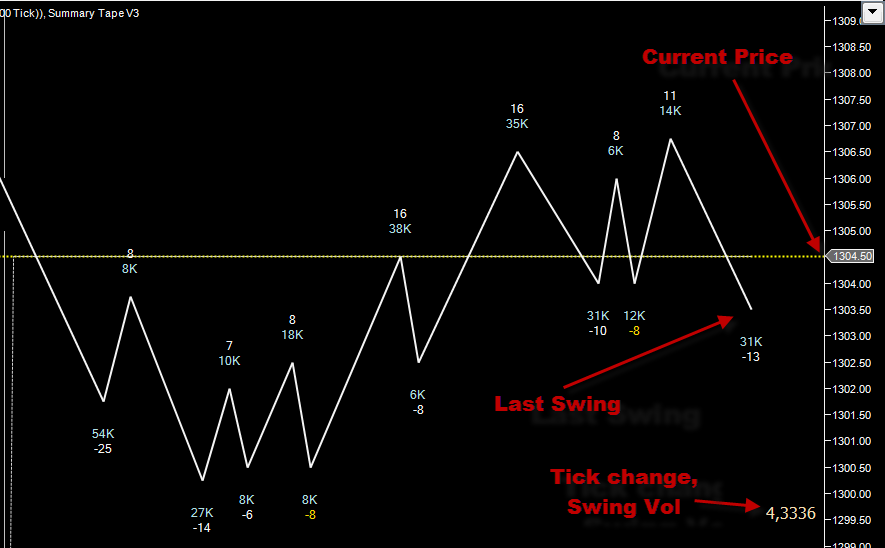
btw - the yellow dotted line on there is the last price - don't think it's something magic! (doesn't lag though... )
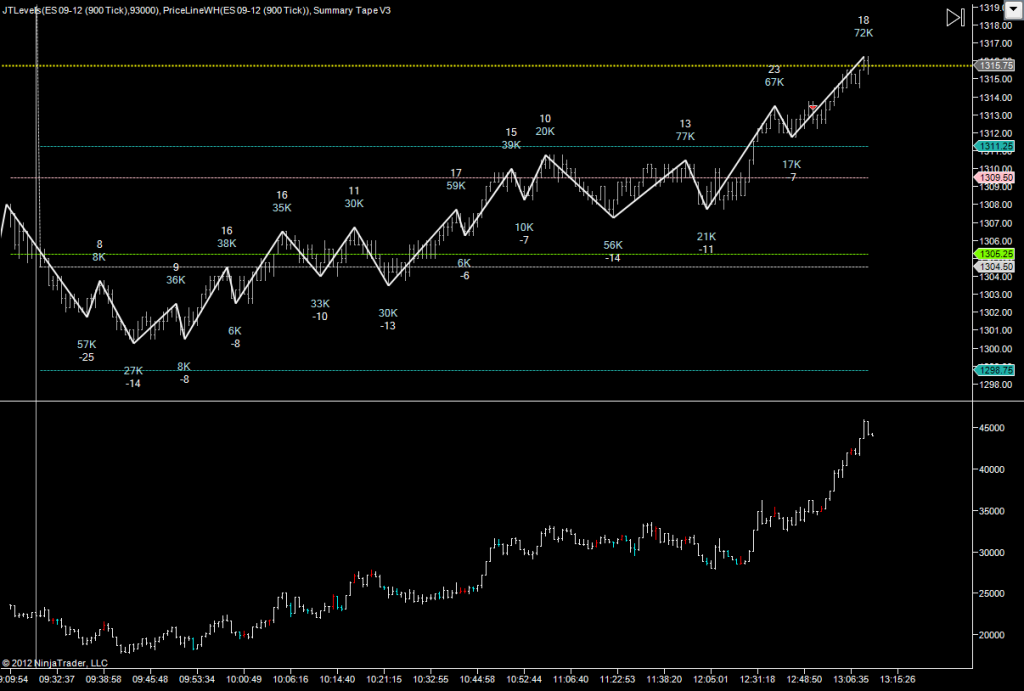
Using the swing volume and the ticks to help me define my bias. I've been watching this for a few weeks and it's been quite interesting. Especially on days where the Cumulative Delta is quite flat. For most of today it's been very flat. I like to see 10k swing in delta on a good price swing, then a small delta shift on the next opposing swing. That gives me confidence to follow the direction of the first swing.
That sort of strength/weakness would be hard to track using the CD on lower volume days.
I was going to make a change to this indicator for my own use but I didn't look at doing it yet and I actually think this might be something the standard indicator could use.
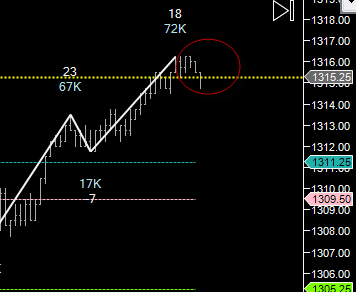
Theare are times between plotting the last swing where there is no information about the swing in progress (which of course could end up being an extension of the prior swing)
In this case, we can see a red circle around some price action that is occurring after the last swing has plotted. In my case, the pertinent information I'd like to know at this point is what is the tick change & volume of the action since that last swing was plotted.
Is this a candidate for the standard indicator? Anyone else see the benefit?
Yes this can be done by going to the indicators options menu and under "Swing Values" choose the drop down menu "swing visualization type" and choose dots. This will remove the zig-zag line plotting. Attached is a screenshot which shows the option location.
i was wondering what was going on here with these values on the waves?
and a second question, is it possible to show the volume of the wave at the bottom like weiswave does? i know there in an indicator for weiswave here on the forums that cleaned up a bit but still causes my NT to crash.
dont believe anything you hear and only half of what you see
i was wondering what was going on here with these values on the waves?
and a second question, is it possible to show the volume of the wave at the bottom like weiswave does? i know there in an indicator for weiswave here on the forums that Zondor …
thanks for your support
i was also noticing that it doesnt plot the volume in some areas.. i kinda picked up on the conversation halfway through..
dont believe anything you hear and only half of what you see


 )
)

 dont believe anything you hear and only half of what you see