Welcome to NexusFi: the best trading community on the planet, with over 150,000 members Sign Up Now for Free
Genuine reviews from real traders, not fake reviews from stealth vendors
Quality education from leading professional traders
We are a friendly, helpful, and positive community
We do not tolerate rude behavior, trolling, or vendors advertising in posts
We are here to help, just let us know what you need
You'll need to register in order to view the content of the threads and start contributing to our community. It's free for basic access, or support us by becoming an Elite Member -- see if you qualify for a discount below.
-- Big Mike, Site Administrator
(If you already have an account, login at the top of the page)
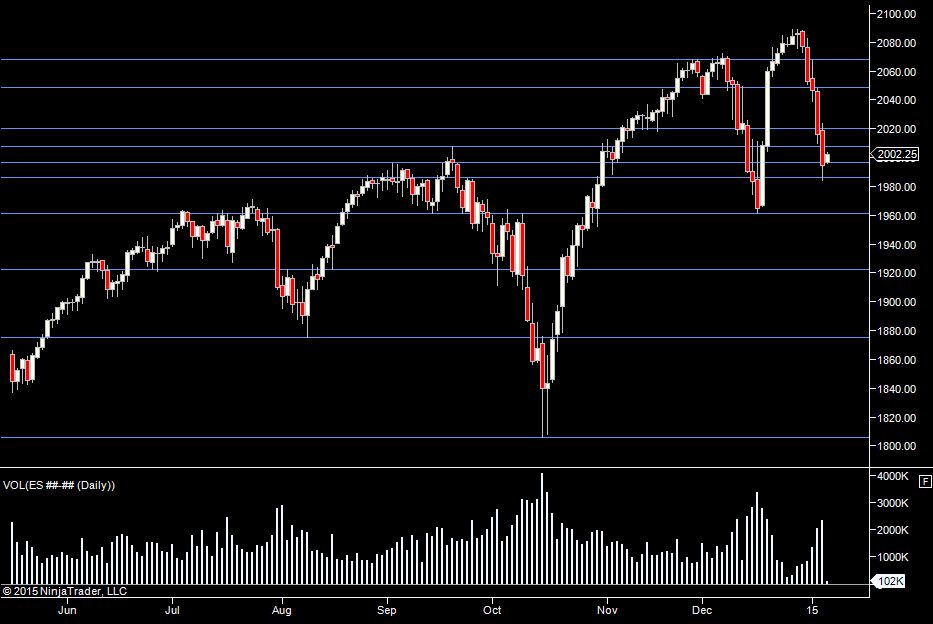
Volume was up again yesterday. It's still very volatile.
Yesterday we said
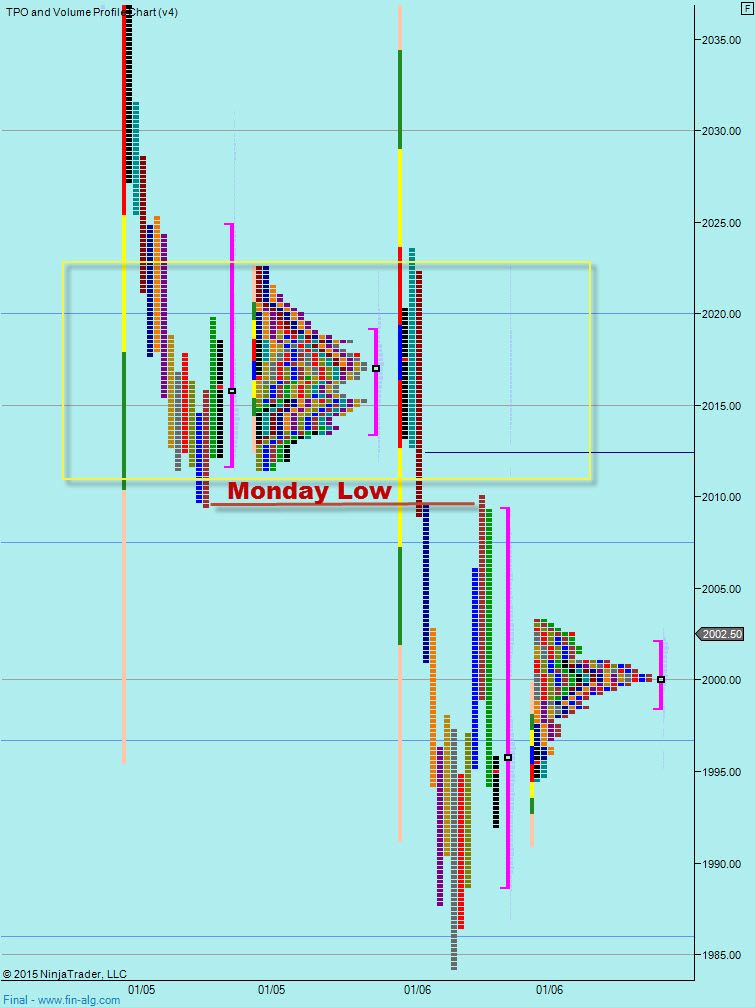
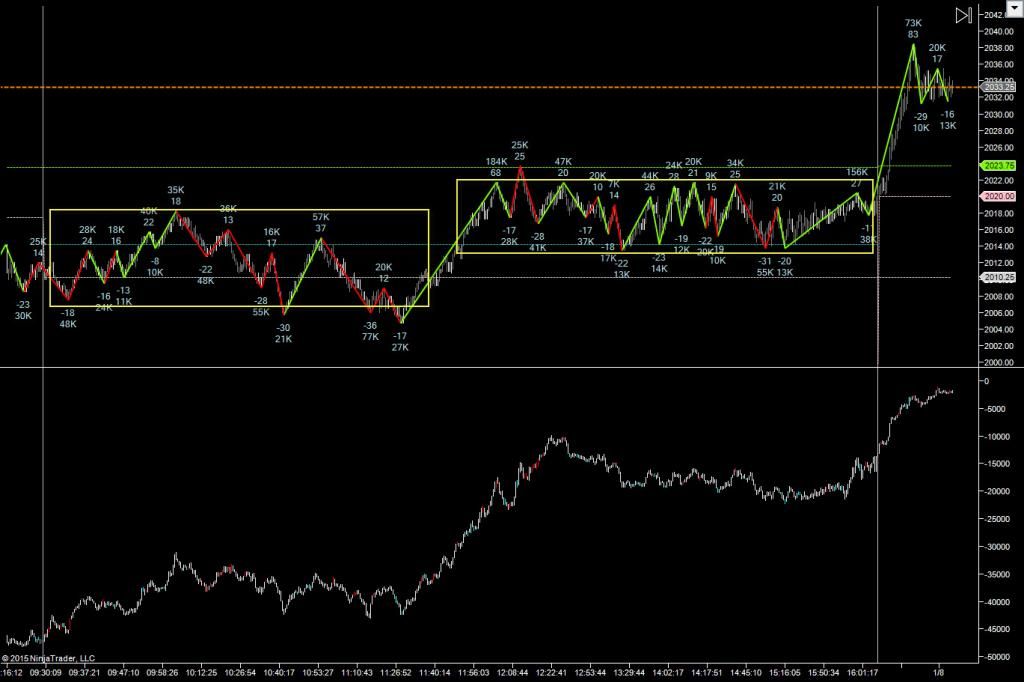
Monday PM had marked out a range and in Tuesday Globex session, we extended that a little to the upside. As Monday opened, we spent the first hour in that range. The range was a tough one, swinging 22, 28, 25 ticks without much chance to jump on at a good price. The breakdown was again very rapid, similar to Mondays move.
Later in the day we came up to tag Mondays low before moving down again.
So today, again looking to see if we are going to break. I have 2010 as a level to look out for as well as yesterdays low. To be honest though, I may switch to Treasuries today. This market is fairly stressful, so unless it breaks down and makes an obvious run, I'm not that interested. The rewards are obviously there but so are the risks and this ES isn't the ES I am used to.
Daily Numbers
Range - 1984.25 -> 2023.50
Value - 1988.75 -> 2010
Globex - 1994.50 -> 2003.50
Settlement - 1994.50
Today only - 2010
Long Term 2068.25, 2047, 2019.75, 2007.50, 1996, 1961, 1922.25, 1878.25, 1806
If you have any questions about the products or services provided, please send me a Private Message or use the futures.io " Ask Me Anything" thread
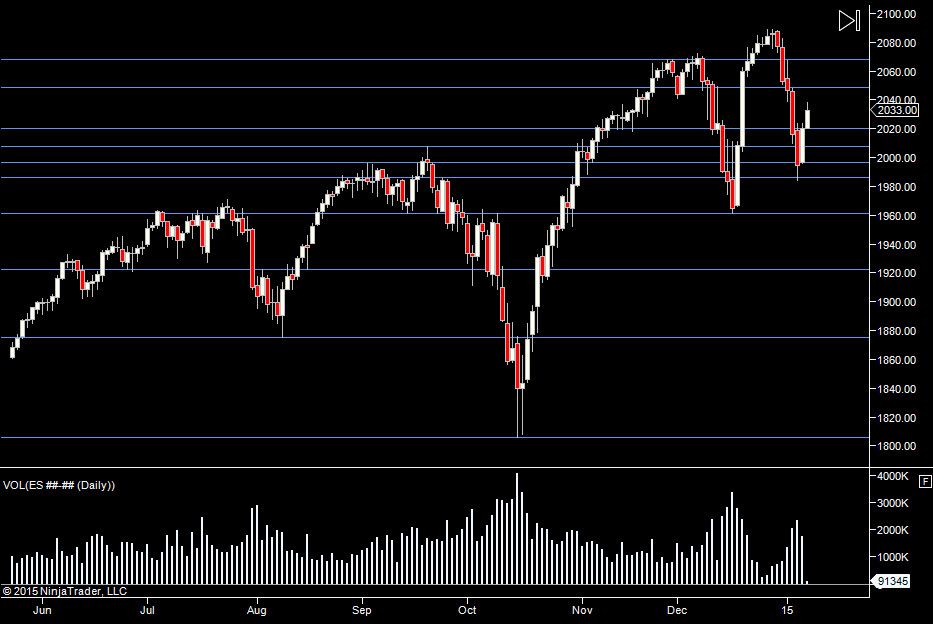
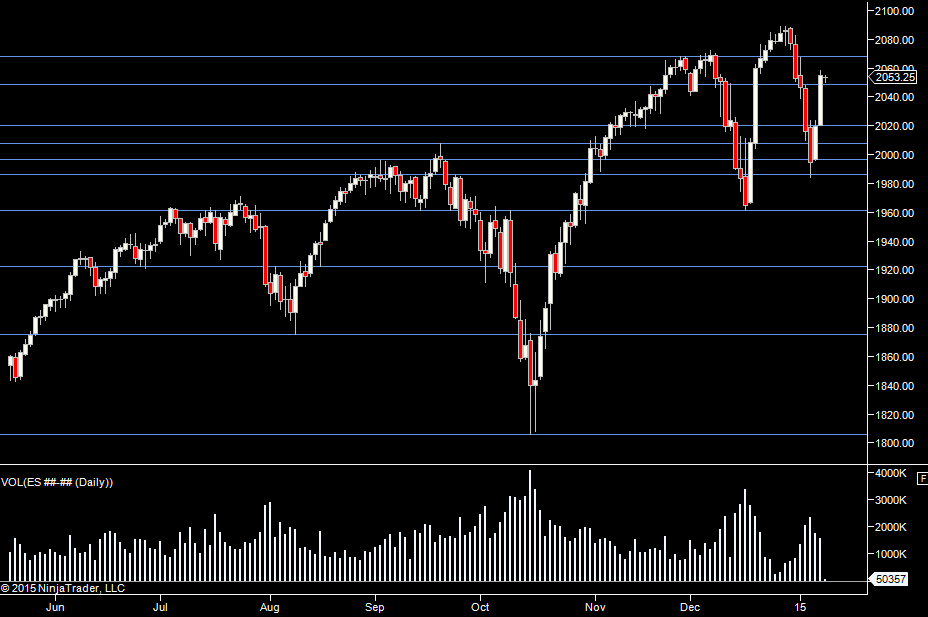
Volume tailed off yesterday but it's still on the high side. What we have to figure out at this point is if this is a pullback in a new downtrend or if the market is heading back up to the highs. We could be marking out a 1960-2100 range that we will stay in for some time if do go back to the highs. That's more for consideration when we get there though.
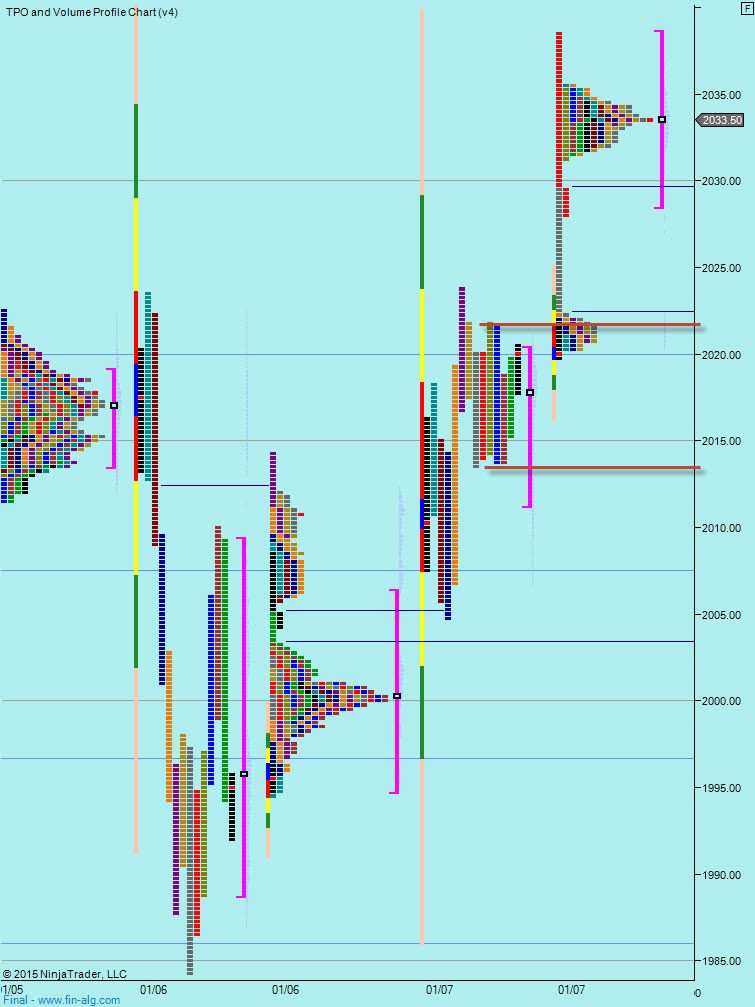
The market marked out a range in the morning and broke up to mark a higher range in the afternoon. For upside, it would be good to see us retest that range. So 2021.50-2023.50 for a retest.
And of course, that is perhaps the 'widest level' we've ever put on our prep. Again I'm including a swing chart - we did have some smaller pullbacks early on yesterday but it was still fairly volatile and that afternoon chops still had some 7 point one way swings. So that level is wide because it's more volatile right now. I think if we do come down there and buyers step in, then that will encourage a lot of speculators to jump on board.
If we head down through 2021.50, it may again be tough and choppy conditions.
If we move up without a retest, then I think it's a lower confidence trade to the long side, leaning on a level that develops intraday. Similarly for shorts, the highest confidence short would be a failure to get through the overnight high.
As always - if we stay high after a big push up in the Globex session, we have to watch out for an early adjustment downwards.
Daily Numbers
Range - 1994.50 (globex) / 2004.75 (pit) -> 2023.75 (same high as prior day)
Value - 2011.25 -> 2020.25
Globex - 2019.75 -> 2038.50
Settlement - 2019.50
Today only - 2021.50-2023.50
Long Term 2068.25, 2047, 2019.75, 2007.50, 1996, 1961, 1922.25, 1878.25, 1806
If you have any questions about the products or services provided, please send me a Private Message or use the futures.io " Ask Me Anything" thread
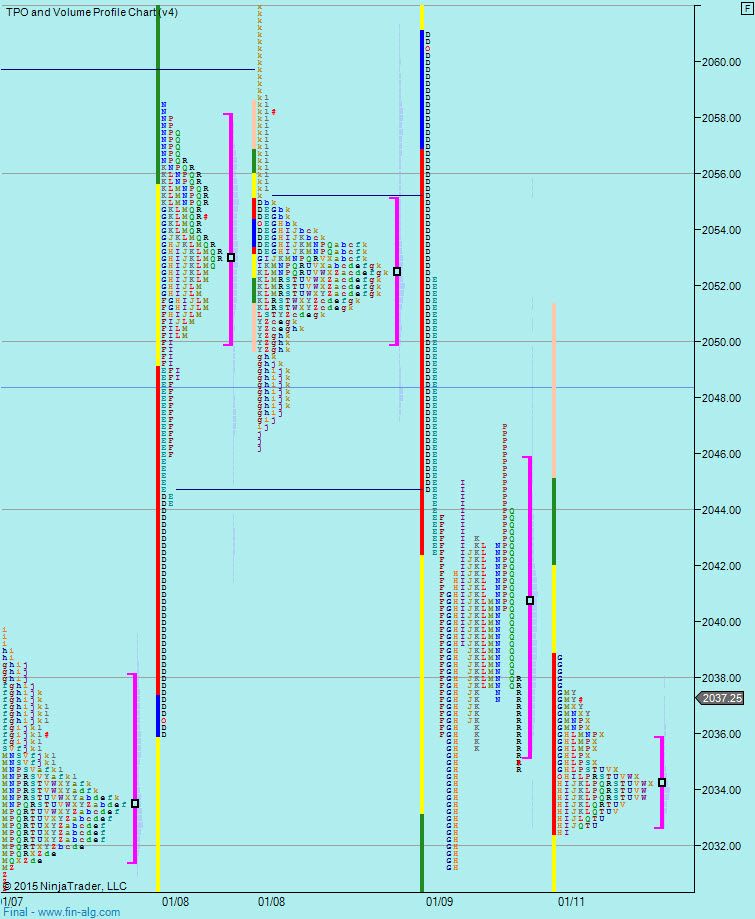
Expectation now is we go to test the highs or get very close and fail. I think down from here without a test is less likely. Yesterdays action was more like the ES we know and love - move, build volume, move, build volume etc. We did chop around when we got to the highs but I see that more as building volume for the next push.
As such, going into today, 2050 is a key level. If we get below that then some longs will get stopped out and that could cascade into a larger down move. So if we break 2060 and we see volume come in, then we don't have much below us to support price. In the Globex session yesterday some levels had less than 200 contracts trade on the way up. So whilst I still think we are looking at retesting the old highs, there's not much volume traded between 2050 and 2020 to lean on.
So - a retest of 2060 in the pit session would be nice and should see buyers step in and give us a push up. That level has been retested already in the Globex session, so if we push up from here before the open (news may do it), then we have to look for an intraday level to play off. Below 2060, I think we could move down rapidly.
Daily Numbers Range - 2019.74 (globex) / 2036 (pit) -> 20258.50
Value - 2050 -> 2058
Globex - 2049.75 -> 2055
Settlement - 2055
Today only - 2050
Long Term 2068.25, 2047, 2019.75, 2007.50, 1996, 1961, 1922.25, 1878.25, 1806
If you have any questions about the products or services provided, please send me a Private Message or use the futures.io " Ask Me Anything" thread
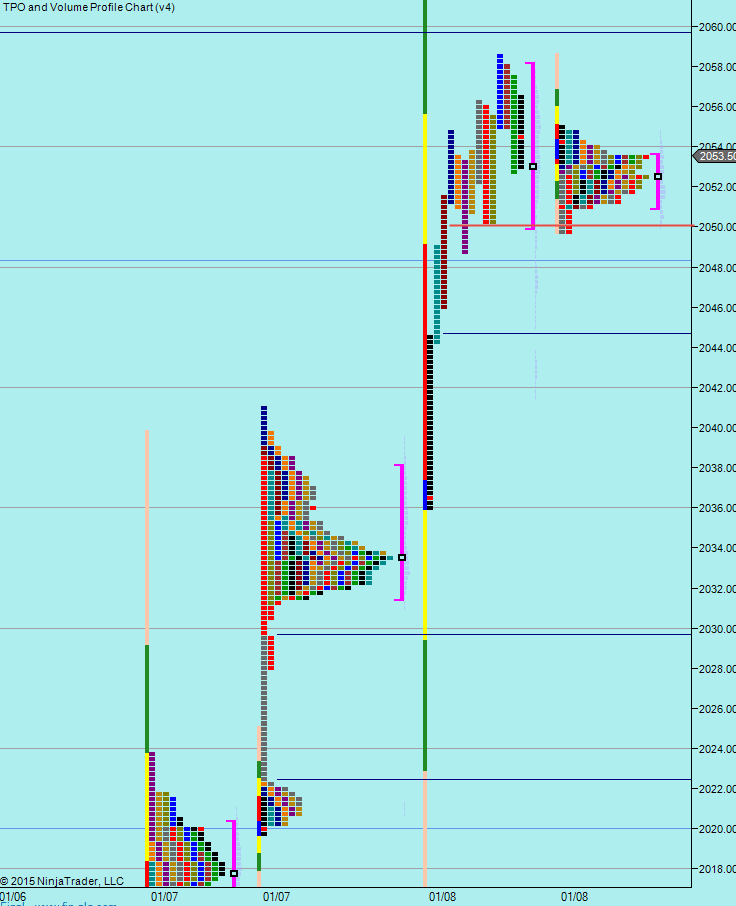
Decent volume again on Friday. Into today, we'll be looking to see if this is just a shaking out of a few longs before we make an attempt at the highs of if we are going to roll over. Obviously, Fridays range breaking either side will help with that. We could break the lows easily in the rest of the Globex session. Into the pis session, I think we have some other levels to look at that will help us confirm.
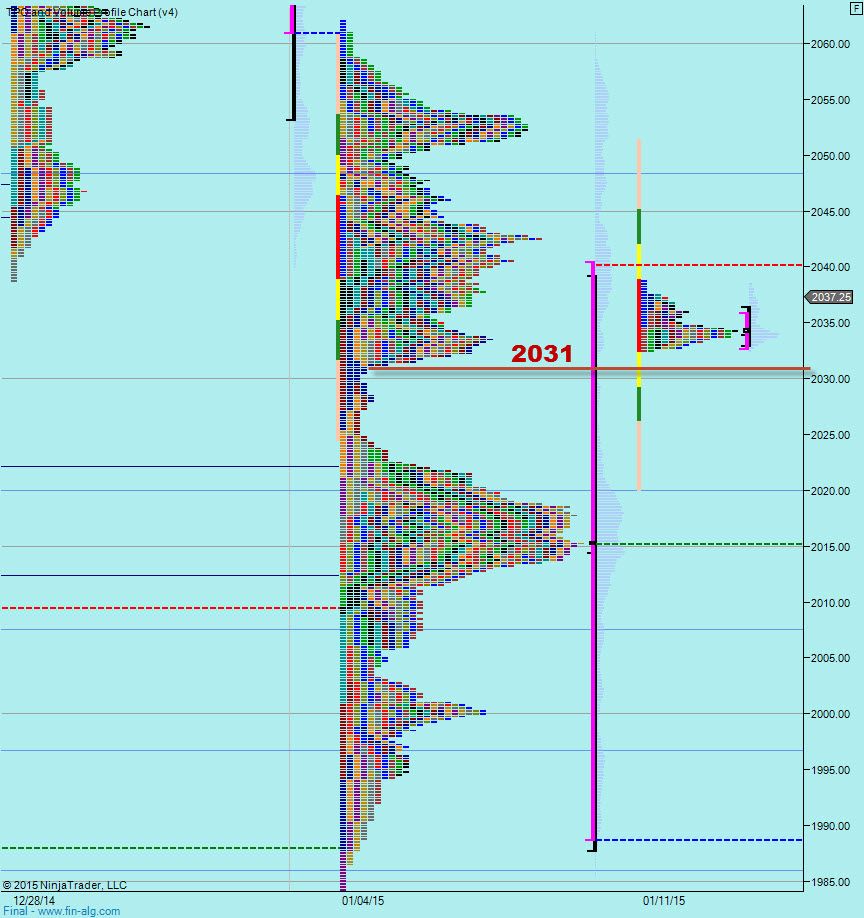
Looking at last weeks profile, we can see that we had fairly thin trading below 2031. So if we do go below 2031, we should move to 2023 or 2020 without much effort. So the first level today to watch is 2031.
We can see Fridays move down then a wide sidways chop. The current Globex session is at the lower end of that chop - which leaves us with the drop below through 2031.
On Friday we said
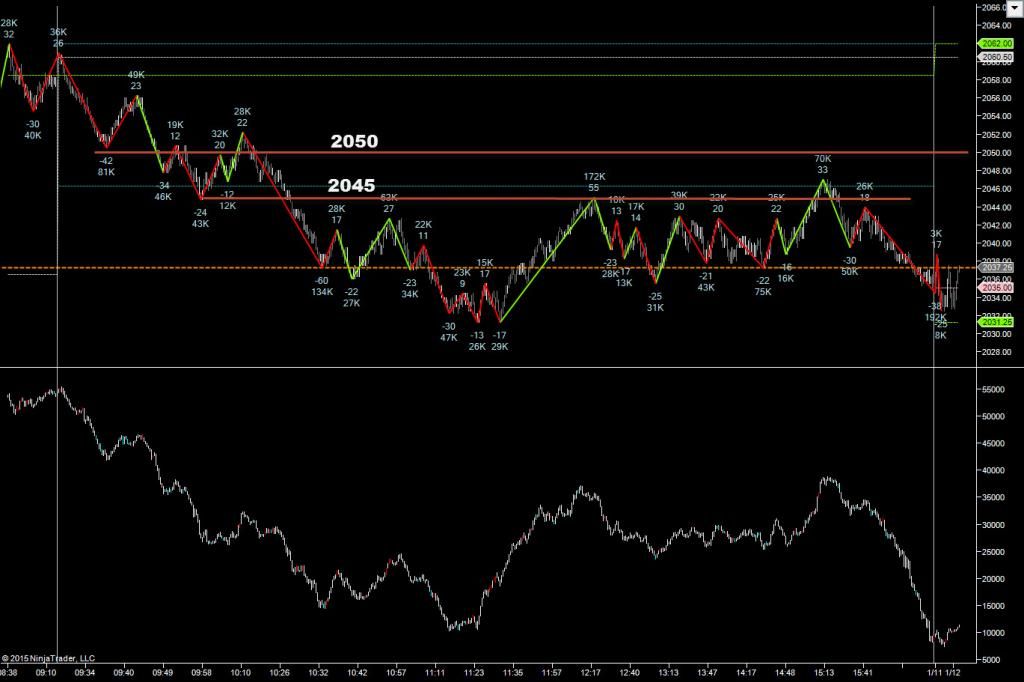
Off the open we made an initial attempt at the overnight highs which failed and sellers came in. We broker through 2050, down to 2045 and then we did manage to take it back to 2052 - but if you look at the delta accompanying that move, it was insignificant. Then we had a big push down - 15 points (60 ticks) and 134,000 contracts - so it does look as if sellers could smell blood and they came in force.
So the 2050 is still on my radar today but also 2045(ish) too because that's where we seemed to flip - the low that became the high of the range for the rest of the day. Of course it did probe upwards but this isn't an exact science.
So today looking for 24 or 50 as areas where speculative sellers might be coming in.
Weekly Numbers
Range - 1984.25 -> 2062
Value - 1988.75 -> 2040.25
S1 1992.50, R1 - 2069.25
Daily Numbers
Range - 2031.25 -> 2061
Value - 2035.25-> 2045.75
Globex - 2032.50-> 2039.75
Settlement - 2035.25
Today - 2031, 2045, 2050
Long Term 2068.25, 2047, 2019.75, 2007.50, 1996, 1961, 1922.25, 1878.25, 1806
If you have any questions about the products or services provided, please send me a Private Message or use the futures.io " Ask Me Anything" thread
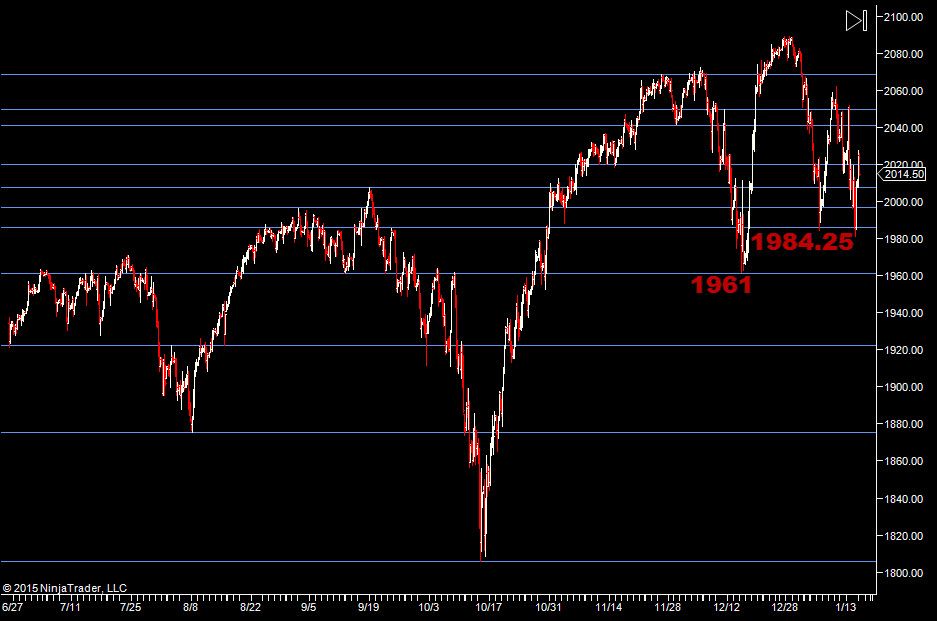
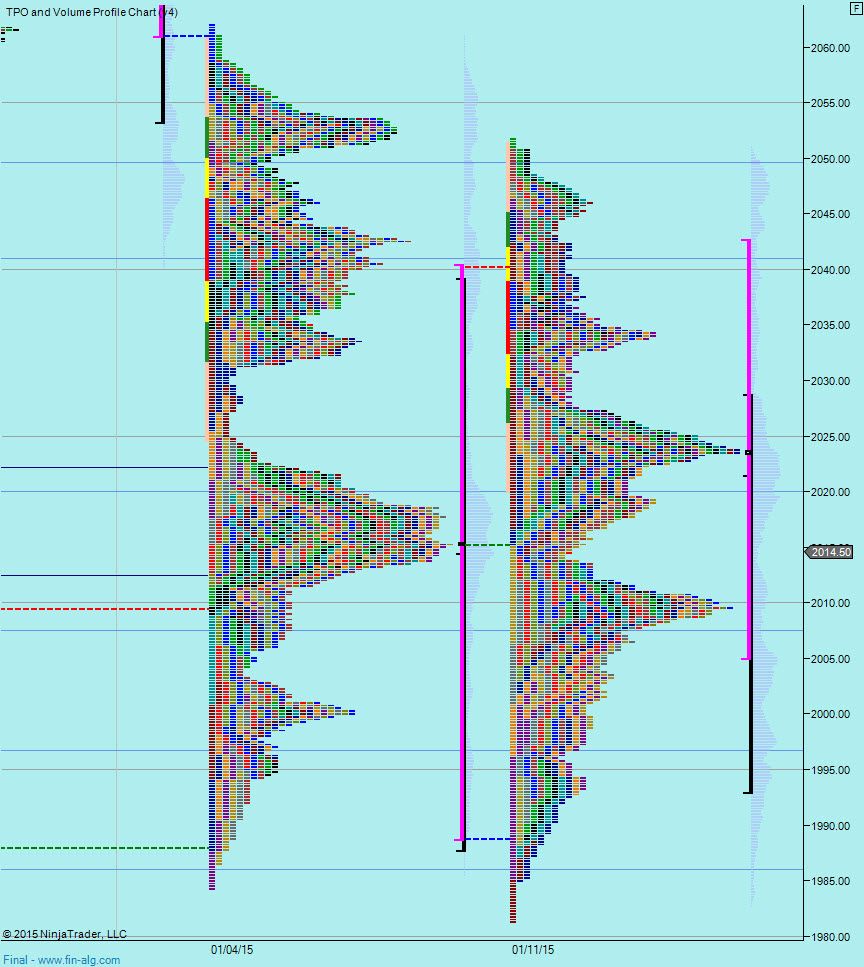
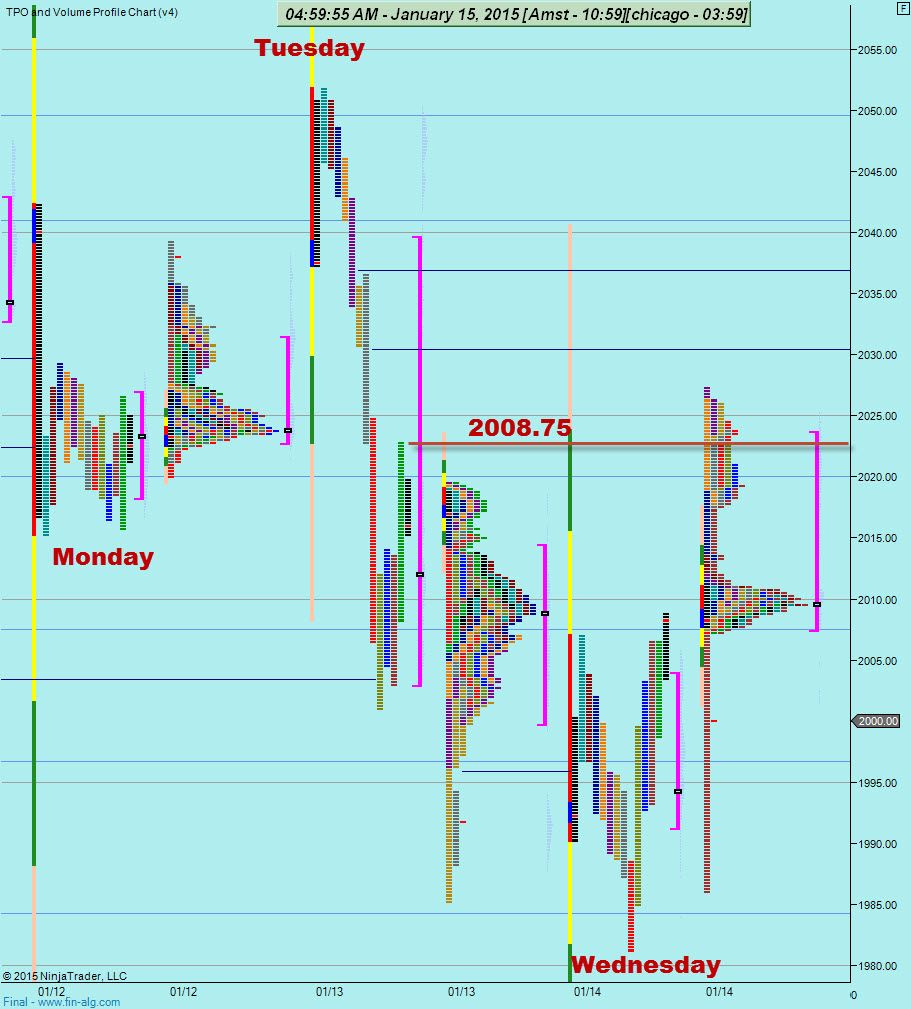
Still high volume & volatile. We took a dip down through the January low that was 1984.25 and then shot back up to 2008.75.
Next level below is 1961, although this is really a coin toss now. Massive participation which seems mostly speculative. In the Globex session we are also putting in some pretty big swings - almost 40 point range overnight so far.
So - another "keep your powder dry" day. As much opportunity as these massive swings provide - people are loosing big on these days too.
This week is overlapping last weeks range - so again, it's hard to take a directional bias from this.
I think we should keep an eye on 2022.75 (typo above says 2008.75) area today. Also to look at yesterdays lows and for a run to 1960 if we break them.
Overall - a good conditions to lose your shirt if you aren't careful.
Weekly Numbers
Range - 1981.25 -> 2051.75
Value - 2004 -> 2042.50
S1 1992.50, R1 - 2069.25
Daily Numbers
Range - 1981.25 -> 2008.75 (pit) / 2019.50
Value - 1991.25 -> 2003.75
Globex - 1986 -> 2027.25
Settlement - 2007.50
Today - 2022.75, 1984.25
Long Term 2068.25, 2047, 2019.75, 2007.50, 1996, 1961, 1922.25, 1878.25, 1806
If you have any questions about the products or services provided, please send me a Private Message or use the futures.io " Ask Me Anything" thread
Yesterday, today, tomorrow is contract roll for /CL FEB G to MAR H
I attribute the price rally rout at end of day yesterday to basically who the hell wants to go out at the low of the contract (taking profits/ both.)
And looking at the price action on the DOM today for G & H it looks as though they are just trying to square up the two contracts (although I believe nobody knows what the hell, what to do with oil at these price levels.)
Does /ES go through these temper tantrums of, I'm right you're wrong at contract roll? (/CL is all over the place on both contracts.)
If so what should we be looking for other than price acceptance/ rejection and how should it be approached other than being flat and let 'em duke it out?
Meh, just throwing some stuff out there
Thank you
-Bill_M
EDIT 0820amET
Maybe this?
Or this?
All I know is there's a bunch of f**** happy campers out there,,,,,,,
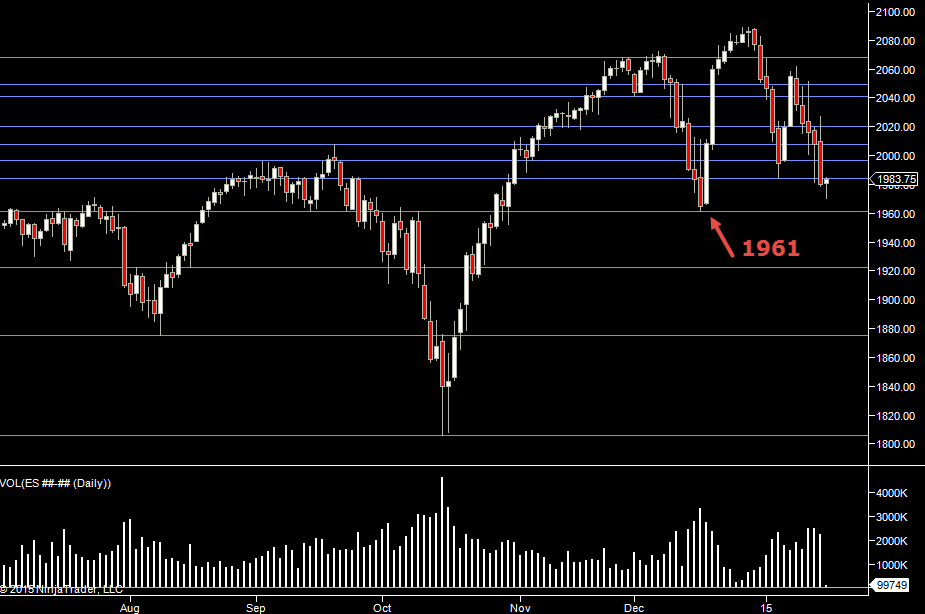
We are getting close to the 1961 level which is obviously very significant.
So today, I'm looking for a test there. If it breaks I can see a lot of people jumping in and pushing it down. If it holds, then I think that will give buyers a bit of confidence.
I'm not really too interested in anything else today. It is a Friday at the end of a massively volatile week and there is a chance that we see the action fade by lunchtime.
With the volatility, it's been a bit of a crap shoot this week, so there's no need to overanalyze it. Hopefully sanity will return next week.
If you have any questions about the products or services provided, please send me a Private Message or use the futures.io " Ask Me Anything" thread
At rollover time it can be very unpredictable indeed.
If you think about it from an Order Flow perspective, a lot of the trades are actually closing positions in one contract to open in the other - but there's no directional bias in those trades.
So I tend to just stay out of the way mostly.
If you have any questions about the products or services provided, please send me a Private Message or use the futures.io " Ask Me Anything" thread
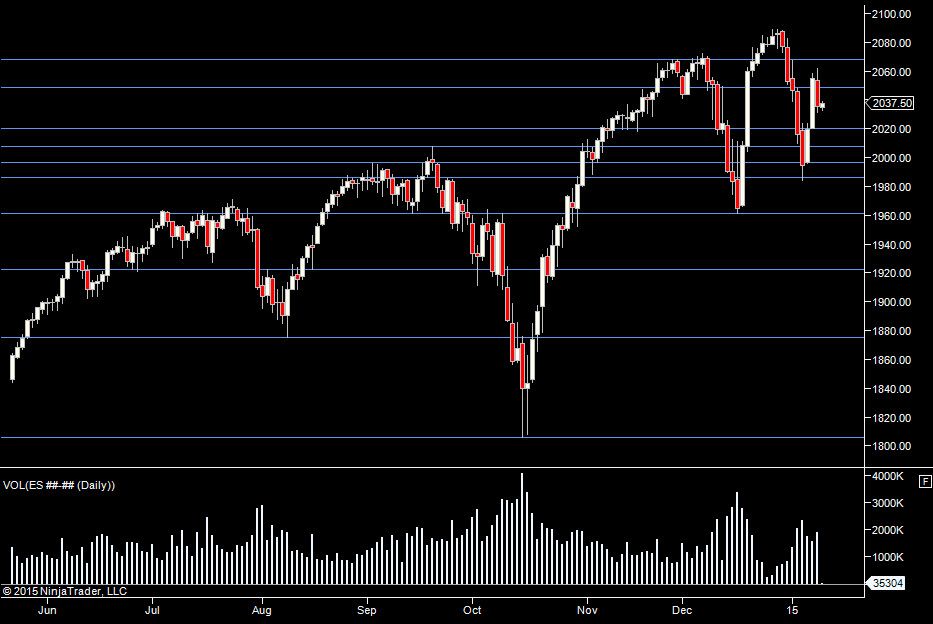
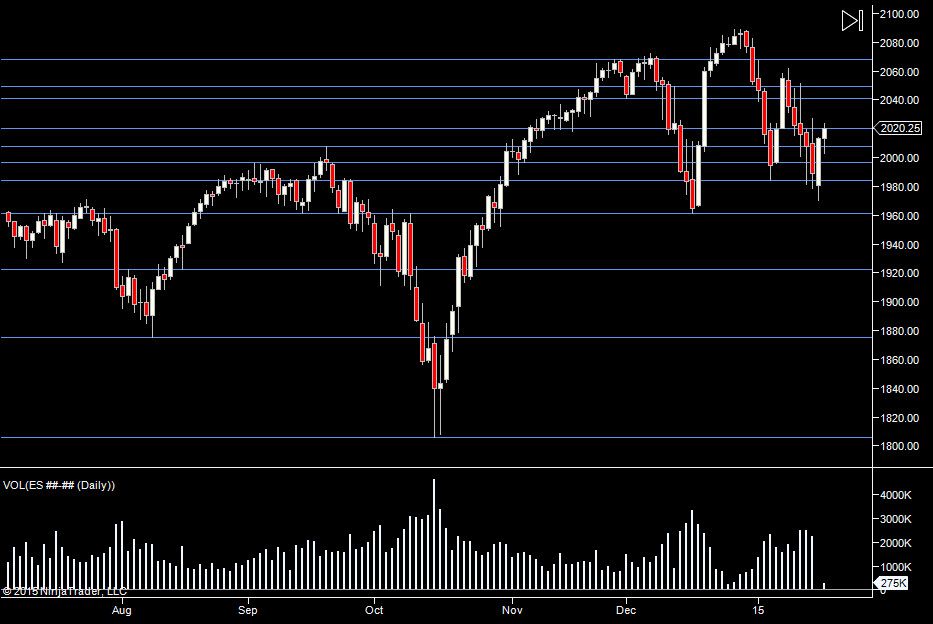
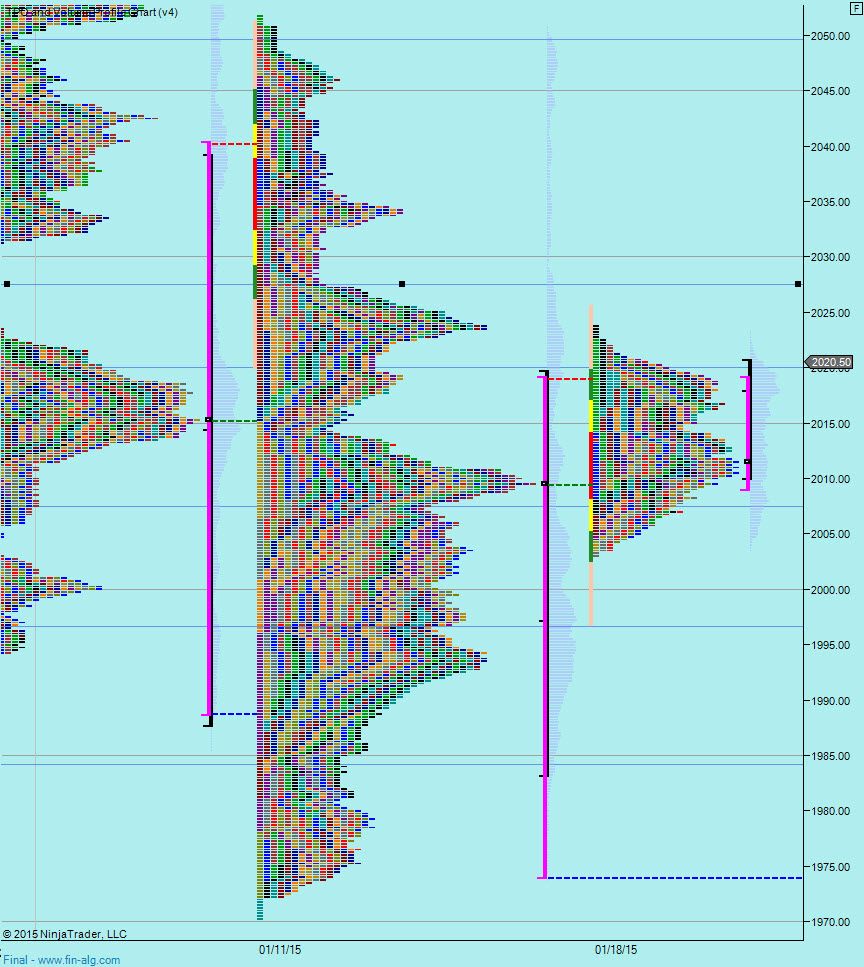
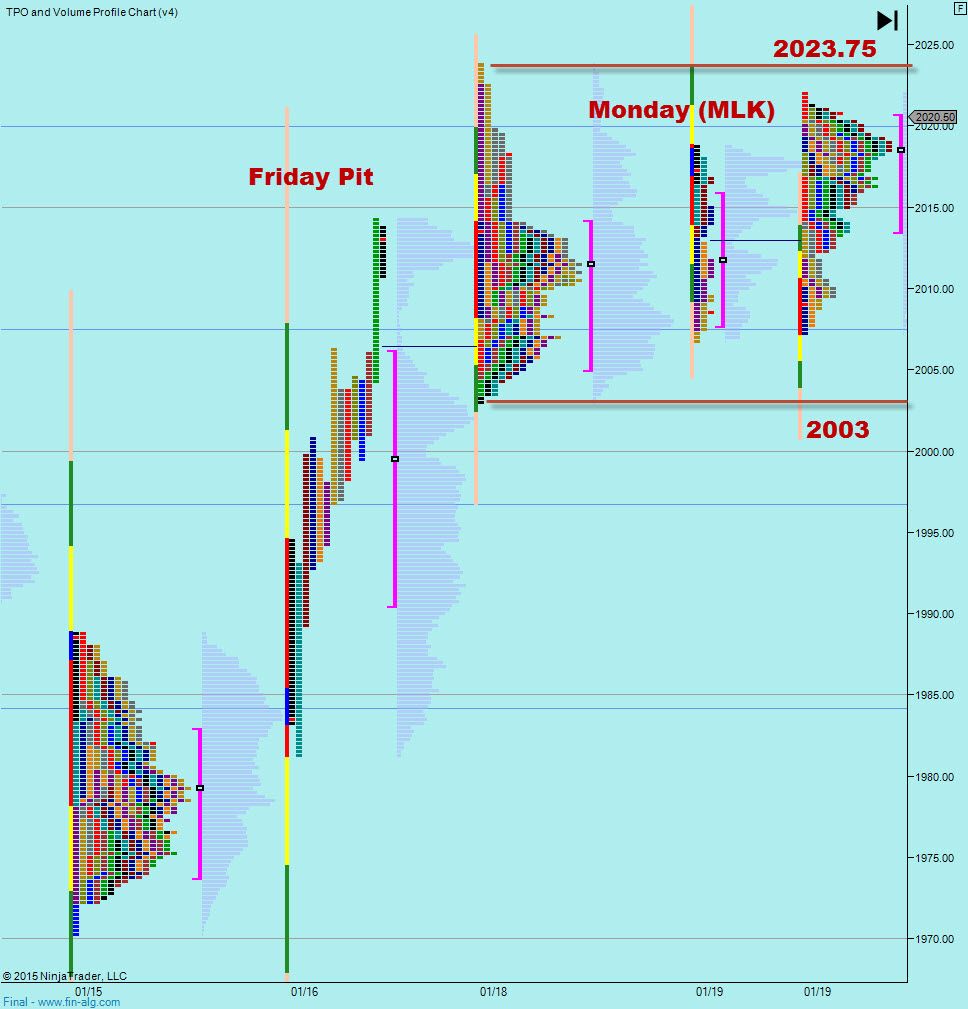
MLK day yesterday. So using last weeks prices for reference. It would be difficult to have a strong directional bias going into today. We are in the middle of last weeks range, we are in the middle of last weeks range but in a period of overall low liquidity/high volatility.
So one eye on volatility (or lack thereof) and one eye on the market making a break.
Not much to say about this, other that it doesn't tell us much. That's a large weekly range. We didn't make it down to 1961 and I still think if that breaks, sellers will try to push it down more and squeeze out some longs.
I'd like to see us test either 2003 or 2023.75 before making a trade. I also have an eye on Fridays lows but they are so far away I rather hope I'd be in a trade way before we got there. For now - I just want to see what happens at those 2 prices. I think testing/breaking either is going to attract attention.
Weekly Numbers
Range - 1970.25 -> 2051.75
Value - 1974 -> 2019
S1 1992.50, R1 - 2069.25
Hi Pete,
I was wondering what the significance of the 1960 level is on the ES?
Big Mike mentioned this level on the ESpoonalysis a couple of times and now that you have mentioned 1961, I was wondering what is special about that number.......
Thanks!
"Napoleans severest comment on his beaten enemies - that they "saw to many things at once""- Hart