Welcome to NexusFi: the best trading community on the planet, with over 150,000 members Sign Up Now for Free
Genuine reviews from real traders, not fake reviews from stealth vendors
Quality education from leading professional traders
We are a friendly, helpful, and positive community
We do not tolerate rude behavior, trolling, or vendors advertising in posts
We are here to help, just let us know what you need
You'll need to register in order to view the content of the threads and start contributing to our community. It's free for basic access, or support us by becoming an Elite Member -- see if you qualify for a discount below.
-- Big Mike, Site Administrator
(If you already have an account, login at the top of the page)
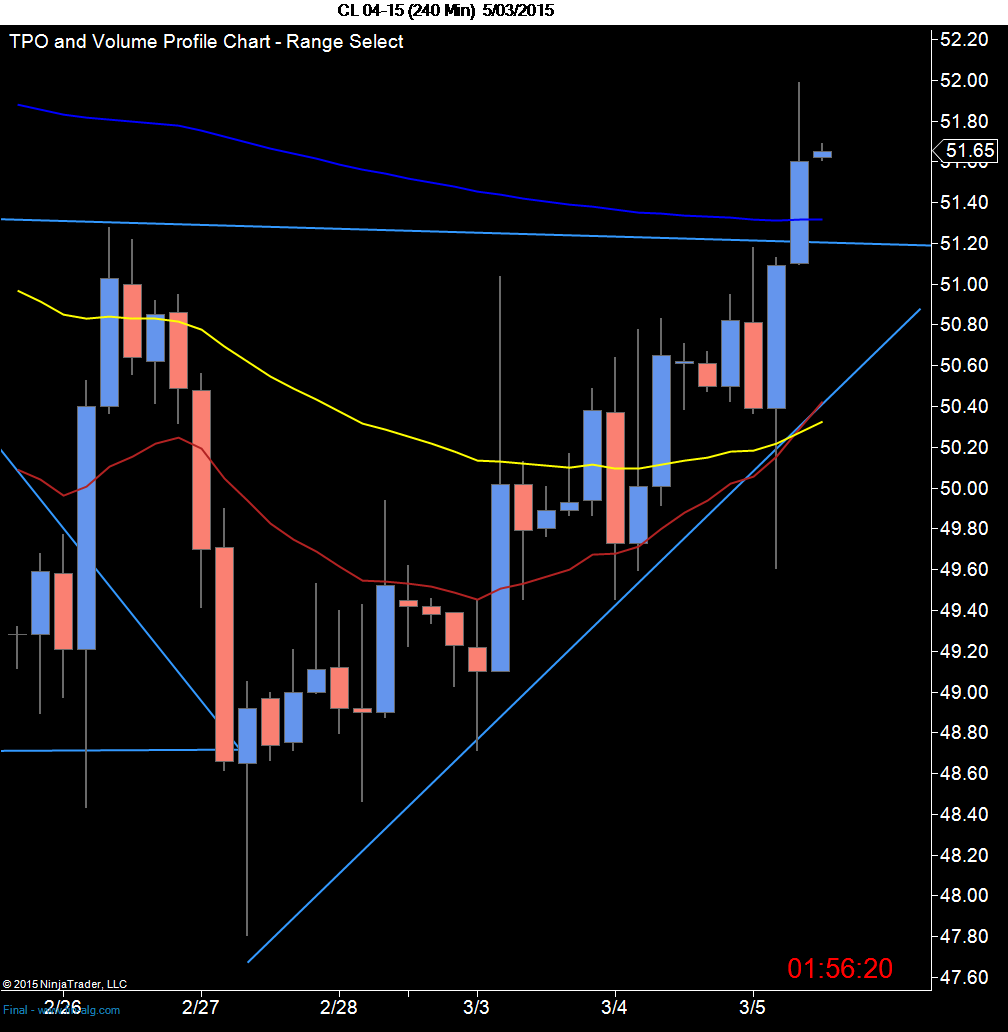
For me , the chart gives context. In this case, knowing that lower zone of support turned out to be useful information this morning when the inventory report was released. Maybe it helped someone here this morning, in any event, here is the resulting chart at the end of the day....
Looking to go long within todays OR. that's one scenario. Next scenario will be to short on one more flush up above 52. I was hoping for one into the close but no go. Thee most profitable and exciting short for me is when we get couple of flush ups of 200+ ticks.
My posts are not meant to give financial advice neither do they imply that my method is special. "THIS IS WHAT I COULD BE IF I HAD A TOTALLY CARE FREE STATE OF MIND DURING TRADING" Mark Douglas.
Been very hard to trade this beast over the past week. Gave back many weeks worth of profit.
Times like this, you gotta RESET, adapt to changing conditions, then apply in context.
However you still have the voice in the back screaming out to get all that money back!
Do you guys see any fundamental reasons as to why the price is rising despite the supply glut? Two of which i believe are the comments from the Saudi minister and the news on Iran.
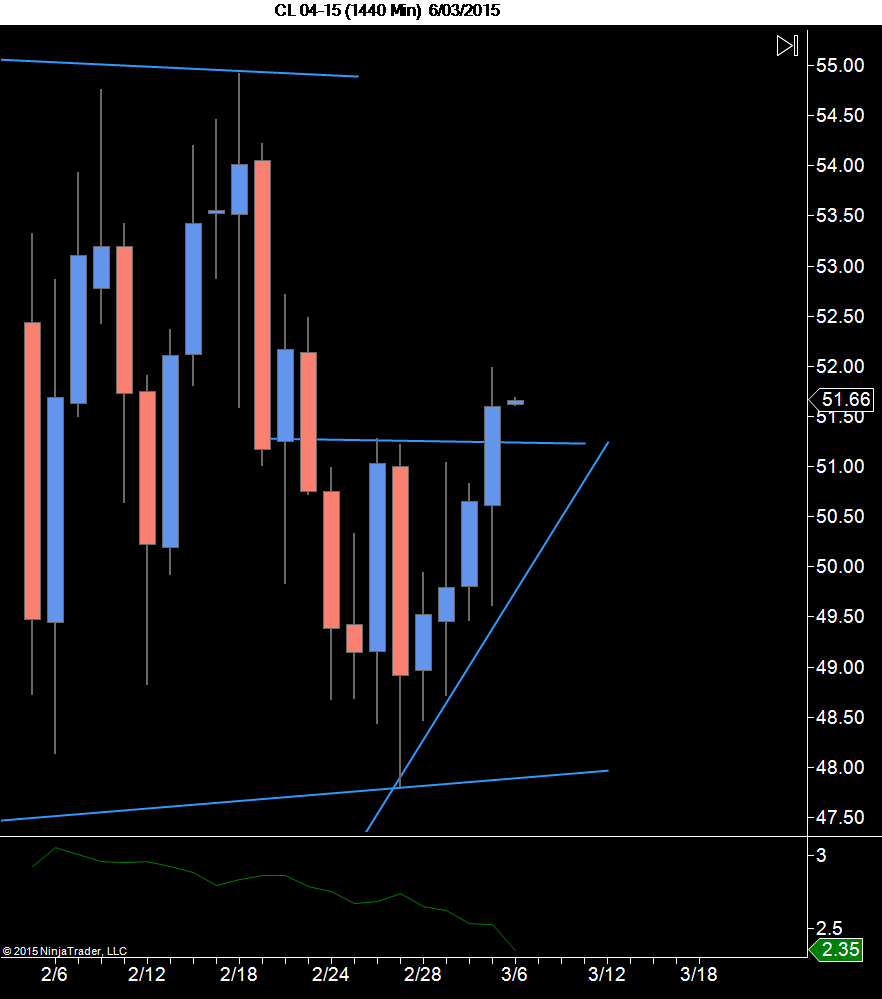
For the past week we have been trading in this technical range.
Here, yesterday was adding to shorts up to the 51.00 area. These were added during Asian and Euro sessions.
Was targeting Gap and areas below before Oil report. Covered. Waited for report which came out above as expected.
Did a quick scalp short down.
Yes I ask myself this everyday. I put it down to this beast being like a rubber-band.
It has been stretched so much over the past 2-4 months. The rubber-band cannot stay stretched forever.
It has to comeback a little. The question as a trader is by how much?
After yesterdays HUGE increase in supply (highest in 15 years) this beast STILL WANTS TO GO UP!
Its trying to say something!
The failure of the conventional price pattern (posted previously) warned that it might be wise to be on the sidelines...if one eliminated the previous 3-4 days of your daily chart you might even see that last night price picked up from where the pattern failed...I would suggest the market already knows about the supply issue...other things are driving price...right now it seems fair price from a sellers point of view is higher...they don't seem to want to sell below 50.00...so buyers are having to bid up price...the question is will buyers see prices at 52.50 and above as unfair? Small trade last night out of opening range at 50.70 for a 32 tick gain back into support...then went to bed...tonight would like to see 51.30 hold for a possible long entry...but if it fails then short to 50.80 and lower...