Welcome to NexusFi: the best trading community on the planet, with over 200,000 members Sign Up Now for Free
Genuine reviews from real traders, not fake reviews from stealth vendors
Quality education from leading professional traders
We are a friendly, helpful, and positive community
We do not tolerate rude behavior, trolling, or vendors advertising in posts
We are here to help, just let us know what you need
You'll need to register in order to view the content of the threads and start contributing to our community. It's free for basic access, or support us by becoming an Elite Member -- discounts are available after registering.
-- Big Mike, Site Administrator
(If you already have an account, login at the top of the page)
What is a Rig and who is Baker Huges? Just kidding. Afetr seeing these rig counts reports from Bill, i asked a friend of mine who looks at these things and he did confirmed that lately on Fridays around 1 pm there is impact on CL from rig count report. He tried to explain to me details of it but it was too confusing for me plus he does not day trade, so i decided not to worry about it.
I have been trading CL for almost 5 years and i have seen more information related to CL over last 2 weeks in this thread than in 5 years combined. I have started to wonder how i traded without some of this info? The only thing at least today mattered was there was no Bid for CL and since i have to pick a reason for it, i blamed it on US $. It's good to see different point of views.
I wish some other traders besides Bill will post trades, set ups.
My posts are not meant to give financial advice neither do they imply that my method is special. "THIS IS WHAT I COULD BE IF I HAD A TOTALLY CARE FREE STATE OF MIND DURING TRADING" Mark Douglas.
Can you help answer these questions from other members on NexusFi?
I'm currently flat any oil contracts. I closed most of my arb positions in the end of last week and the rest on Monday. Was building them in the beginning of Feb. Considering recent Cush stocks developments, it was a no-brainer. WTI is in a very tight range that makes me staying on sidelines now. Re day trading - didn't trade it today but 10y and 30y bonds post-unemployment-report instead. Cheers
Trading: Primarily Energy but also a little Equities, Fixed Income, Metals, U308 and Crypto.
Frequency: Many times daily
Duration: Never
Posts: 5,241 since Dec 2013
Thanks Given: 4,586
Thanks Received: 10,532
Stating the obvious, different time frames are moved by different information.
The longer the time frame you look at the greater the importance of fundamental information.
The shorter the time frame the greater the importance of order flow.
I think you would be amazed how much information traders on energy prop desks (at energy companies, trading companies, banks etc) see and hear on a daily basis.
I don't trade outrights, I don't trade technically, and I avoid the prompt month.
I did sell some MNQU fly spreads on Friday among other things.
Trading: Primarily Energy but also a little Equities, Fixed Income, Metals, U308 and Crypto.
Frequency: Many times daily
Duration: Never
Posts: 5,241 since Dec 2013
Thanks Given: 4,586
Thanks Received: 10,532
I used to read zerohedge a lot, everytime I did I came away feeling like I needed to build a bunker in my back yard and fill it with guns, ammo, food & gasoline. (Esp back in 2008!)
There's lots and lots of very interesting info on zerohedge but after years of reading how the world and/or financial system was about to end, I eventually got tired of the doomsday theories.
I could not agree more w/ comment on zerohedge - I found it interesting as far as, hmmm interesting
+++++++++++++++++++++++++++++++++++
Kind of on topic
I don't know how much different stuff I read during the day, some is my God fearing, conservative, bald headed, beer - bourbon drinking, HOG riding, gun toting point of view. Other stuff not so much, but I read them to try and stay balanced etc.
Now if the liberal, progressive pinko commie fags would do the same we'd all be better off (this is not directed at anyone unless of course the shoe fits.)
I've spent several years with David Halsey at eminiaddict dot com using his rule based strategy (more can be found on that if interested via Google.)
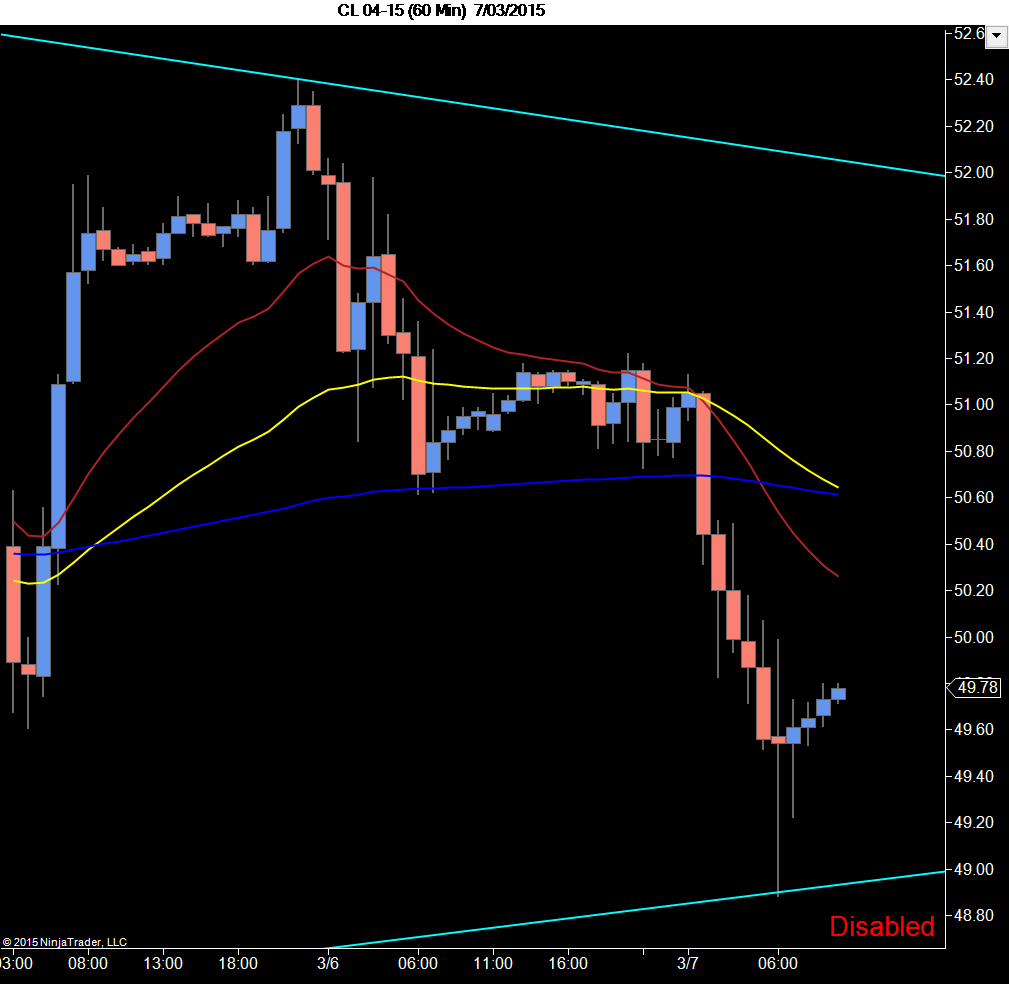
The basic premise is based on high tech drawings. Wait for price to come half-way-back, 50% re-trace, pullback. Most common of these high tech drawings is low to high or high to low typically on an M15 chart. (The below is H1 in order to show all of the most recent data, price action.) The Fib pulls I'm told are reverse 100 to 0. However that's not the point, math is math. The yellow line is 50% and the red line is 61.8%
We have year end, start of new year and three contracts. The first pull (far left of the chart) is swing high, G5 contract high to this year low H5 contract low. And year low (five year low?) to most recent high H5 contract high. Pretty high tech stuff.
The rules are when a 61.8 line is broken (not touched or slightly dipped in) the long pull or short pull (HWB) is broken and *should* signify a trend change. However as noted by the four letters this is not so. If this was /ES or /6E it would most likely be just that. From my experience not so much with /CL it will have more of a "dip in" and reverse direction. More on the A C D in a minute.
What stands out to me is the yellow line at 4891 which signifies HWB long, price is a little more evenly aligned along the bottom than the top (61.8, 5328.)
So what in the Sam Hell does all of this mean? I don't know, you decide (I'm watching 4891.)
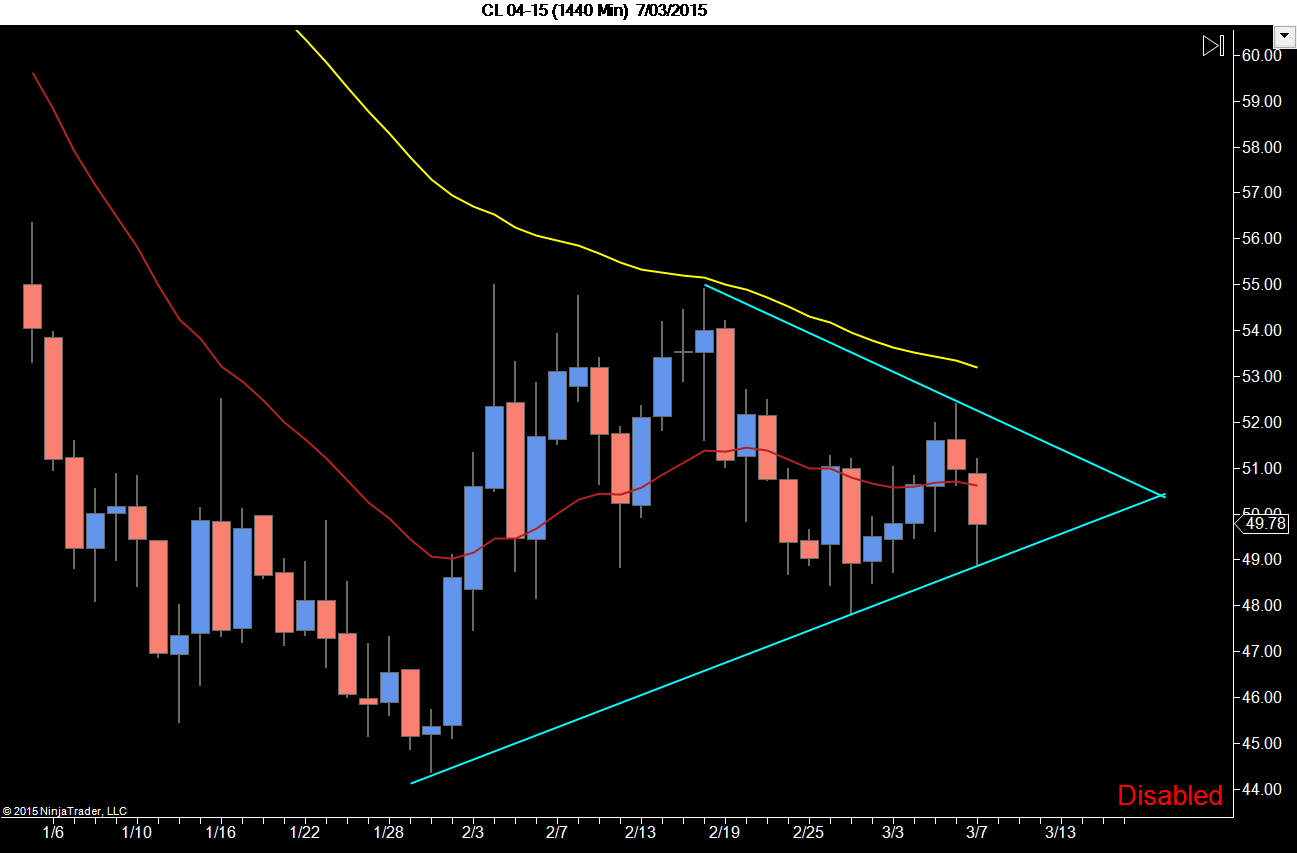
On to a daily chart of /CL.
Same chart zoomed in
What I've drawn here is what Mr Halsey calls an extension. Properly identifying one is not so easy and usually not until far after the fact. The extension short 6381 to 4358 shows an alignment of all the previous "dip ins" shown on the H1 chart above.
A C D. A happened on 2/3, C happened on 2/9 and D happened on 2/17 - 18. Notice all four times price moved away, how quickly I don't know since this a daily chart and the above is an H1 chart. This A C D area is one that will have my attention in the future.
I'll close with this. Yes you can make a line fit to just about any damn thing you want - however something sure as hell stopped price at 5369 (5328.)
Though I trade through GLOBEX sessions, I mainly look for support / resistance areas. What I notice when PIT session begins new areas of S/R are made. I use these areas to simply trade off. However when PIT session opens I religiously respect the OR.
So for the coming session.
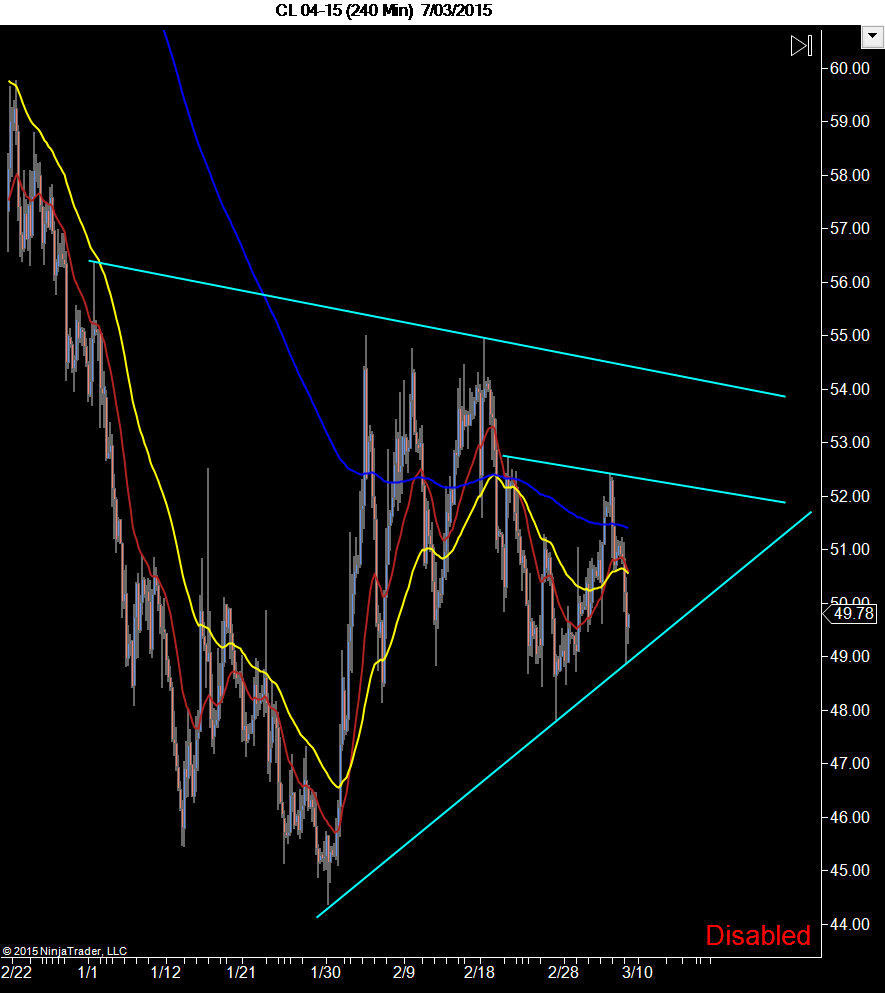
I will look to see how strong support is 49.00 - 49.50. However based on previous swing rejection at 52.50 area (240min) any move up to this area I would be looking to short with larger targets. It simply might just break through down through 49.00 convincingly then I would be short with smaller stop.
Possible scenarios here: Double bottom at 49.50 - 49.40 to play off - Would go long with strong conviction
Retracement Higher from 49.76 to 50.40 - 50.60 area - Would be looking for shorts here.
Break through 49.50 to the downside - Would short with little conviction (higher risk - would use smaller stop) - Would target 49 to 48.70 - 80 area or maybe hold longer for complete breakdown.
Remember I would be respecting these levels through GLOBEX times as well. Usually there is thinner liquidity so moves are quite wild!
Just what I think. Remember anything can happen.
Looking forward to daylight saving hours changing FINALLY. Allows us Aussies to stay up later.