Welcome to NexusFi: the best trading community on the planet, with over 150,000 members Sign Up Now for Free
Genuine reviews from real traders, not fake reviews from stealth vendors
Quality education from leading professional traders
We are a friendly, helpful, and positive community
We do not tolerate rude behavior, trolling, or vendors advertising in posts
We are here to help, just let us know what you need
You'll need to register in order to view the content of the threads and start contributing to our community. It's free for basic access, or support us by becoming an Elite Member -- see if you qualify for a discount below.
-- Big Mike, Site Administrator
(If you already have an account, login at the top of the page)
FOMC is a tough day to trade ACD or any other system. Secondly, per mark Fisher indices are hardest to trade. You should look into CL but practice on TOS ON DEMAND till you are profitable for 20 days. I trade CL full time and now trading es here and there. Besides levels one has to keep context in mind as shown in the chart.
Thanks for letting me know. I was not aware of this. Apparently , screen cast free service has limited storage capacity and they delete charts after couple of days .
As Mark Fisher traded on NYMEX and was a crude trader himself, let us focus on CL. The method works best on physical commodities.
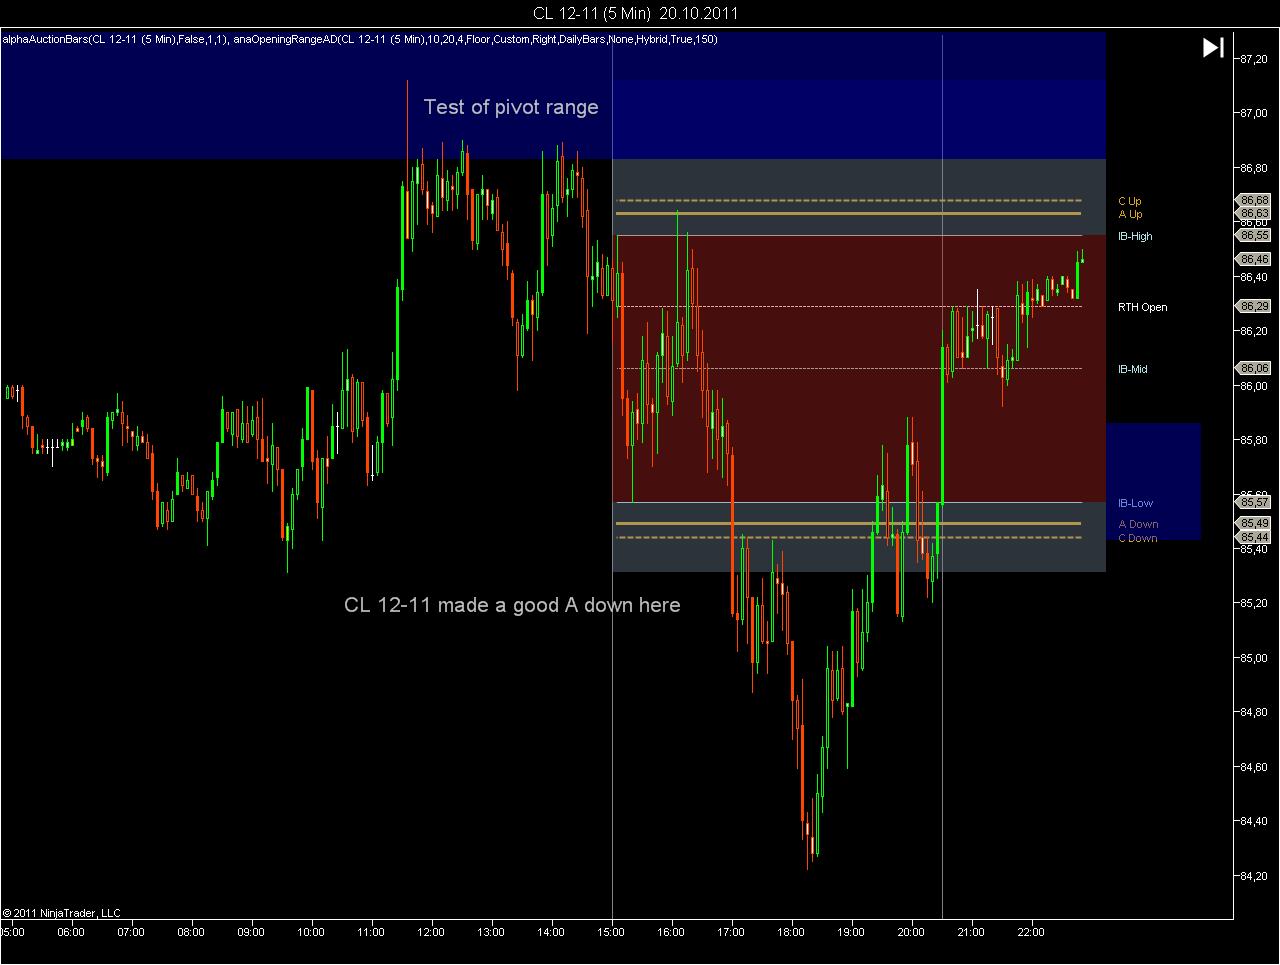
Here is today's chart showing pivot range (RTH), opening range (opening period 45 min) with the A and C values. The pivot range was tested in the early morning / later European morning. CL 12-11 made a good A down around 2h30 into the session, and could have been shorted, after price remained below that level for five bars. All levels and ranges plotted automatically.
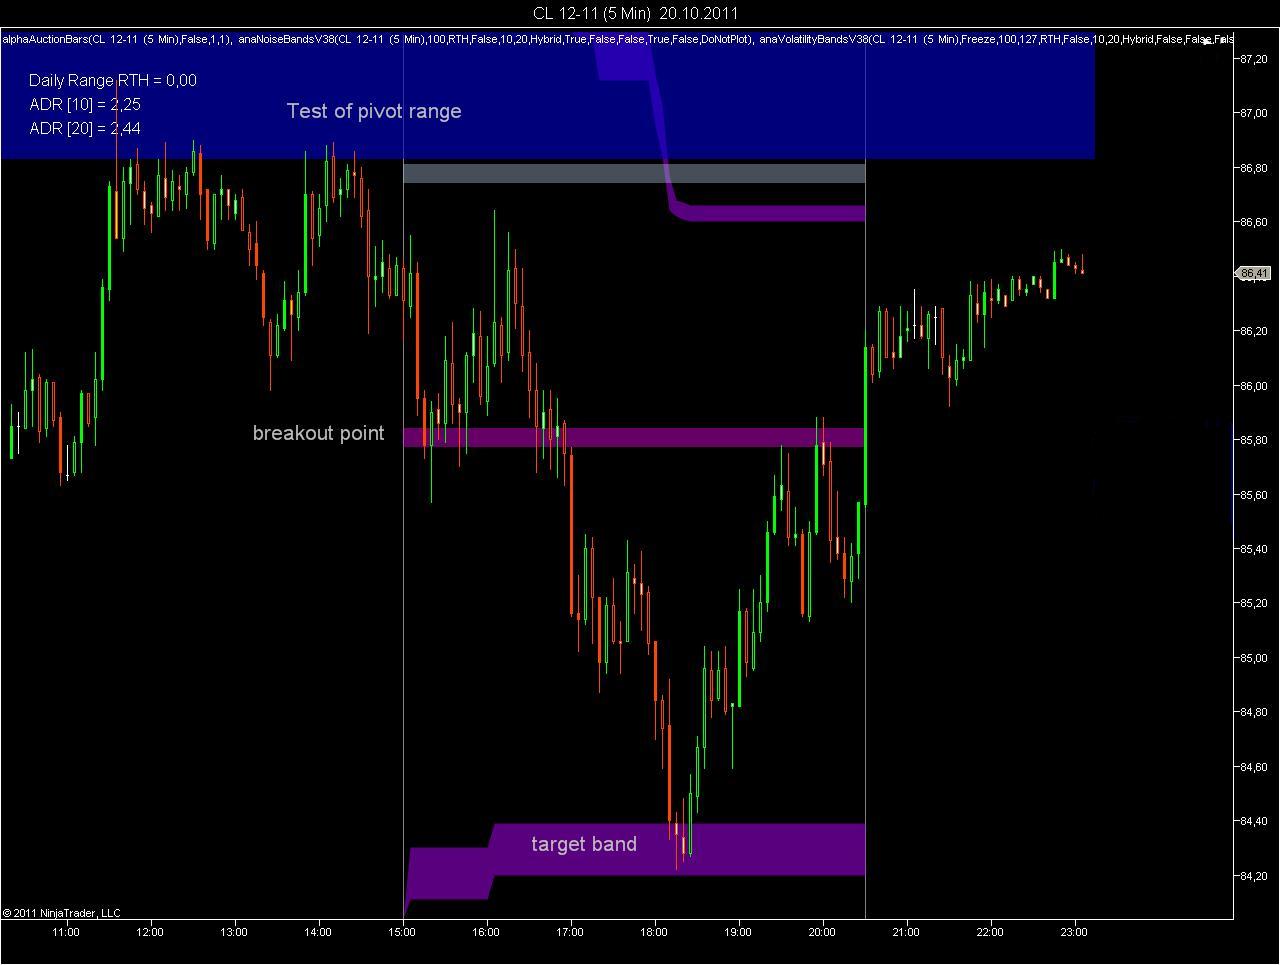
This is the same day, but this time I have used noise bands to define the breakout level and the volatility bands to define the target level to exit the position. The pivot range is used as a trend filter. Do you really need that ACD stuff?
I use 8.30 to 9.15 eastern time for OR as recommended by MF. On Wednesday when we have oil report, I extend OR to 8.30 to 10.45 am. 2 cyan lines represent OR.
Here is daily chart. Today pivot high= 86.22, pivot low=85.67. On my chart dashed yellow line is 3 day rolling pivot low and dashed pink line 3 day rolling pivot high.. 30 day ACD number of 6. Starting past Friday numbers were as following
11,9,10,6. Pivot tracker value of 40. I have seen them as high as 150 and low as 0. As we know lower the pivot tracker value - higher the expected VOLATILITY.
1) I will be first to admit that one needs something else to identify entries, profit targets , stop loss etc besides ACD. On 80% of the days stop loss on 45 minutes OR is more than 100 ticks away. I am constantly trying to identify ways to improve on stop loss as i mostly risk 10-15 ticks. I am using 45 minutes OR but not the stop loss of OR.
2) Your Volatility bands seems to be an excellent tool/alternative with less chance of whip saws. I just did not get a chance to test them. I use TOS platform and they have a feature called ON DEMAND. basically, a trader can pick any trading day over last 3 years and system replays that day exactly. This gives me a chance to manually test it over and over again with randomly selected time periods and thus enhance my intuitive skills set , price action, ACD set ups when they seem to work etc..
I use 8.30 to 9.15 eastern time for OR as recommended by MF. On Wednesday when we have oil report, I extend OR to 8.30 to 10.45 am. A up= 88.15, A down= 87.09, C down= 86.84
Here is daily chart. Today pivot high= 86.22, pivot low=85.67. On my chart dashed yellow line is 3 day rolling pivot low and dashed pink line 3 day rolling pivot high.. 30 day ACD number of 6. Starting past Friday numbers were as following
11,9,10,6. Pivot tracker value of 40. I have seen them as high as 150 and low as 0. As we know lower the pivot tracker value - higher the expected VOLATILITY. 2 cyan lines represent OR
1) I will be first to admit that one needs something else to identify entries, profit targets , stop loss etc besides ACD. On 80% of the days stop loss on 45 minutes OR is more than 100 ticks away. I am constantly trying to identify ways to improve on stop loss as i mostly risk 10-15 ticks. I am using 45 minutes OR but not the stop loss of OR.
2) Your Volatility bands seems to be an excellent tool/alternative with less chance of whip saws. I just did not get a chance to test them. I use TOS platform and they have a feature called ON DEMAND. basically, a trader can pick any trading day over last 3 years and system replays that day exactly. This gives me a chance to manually test it over and over again with randomly selected time periods and thus enhance my intuitive skills set , price action, ACD set ups when they seem to work etc..
I think your volatility bands are for Ninja trader. I will try to find someone who can write the code for me for TOS.
Those target bands are nice. I can never figure out appropriate targets. Also, when price reverses after hitting A down target like it did on 10-20-11 from 84.22 to all the way to 86.40, I have trouble figuring out when to stop shorting on bounces after A down and reverse and go long.
@mfbreakout: You are posting links that will be broken in a few days. The whole thread here will then become useless and clustered with dead posts. I really would appreciate, if you changed your way of posting charts.
I do not use the ACD method. For my taste the breakout signals come late.
Your question regarding when to stop shorting on bounces: If I understand Mark Fisher correctly, you would not add to your position when price moves back into the opening range. The short position you mentioned would have been stopped out, when price moved above the upper end of the opening range, and the long position would have been opened above the C Up level.
It is a breakout setup with a neutral zone in the middle, and on ranging days you will be whipsawed on both sides.