Welcome to NexusFi: the best trading community on the planet, with over 150,000 members Sign Up Now for Free
Genuine reviews from real traders, not fake reviews from stealth vendors
Quality education from leading professional traders
We are a friendly, helpful, and positive community
We do not tolerate rude behavior, trolling, or vendors advertising in posts
We are here to help, just let us know what you need
You'll need to register in order to view the content of the threads and start contributing to our community. It's free for basic access, or support us by becoming an Elite Member -- see if you qualify for a discount below.
-- Big Mike, Site Administrator
(If you already have an account, login at the top of the page)
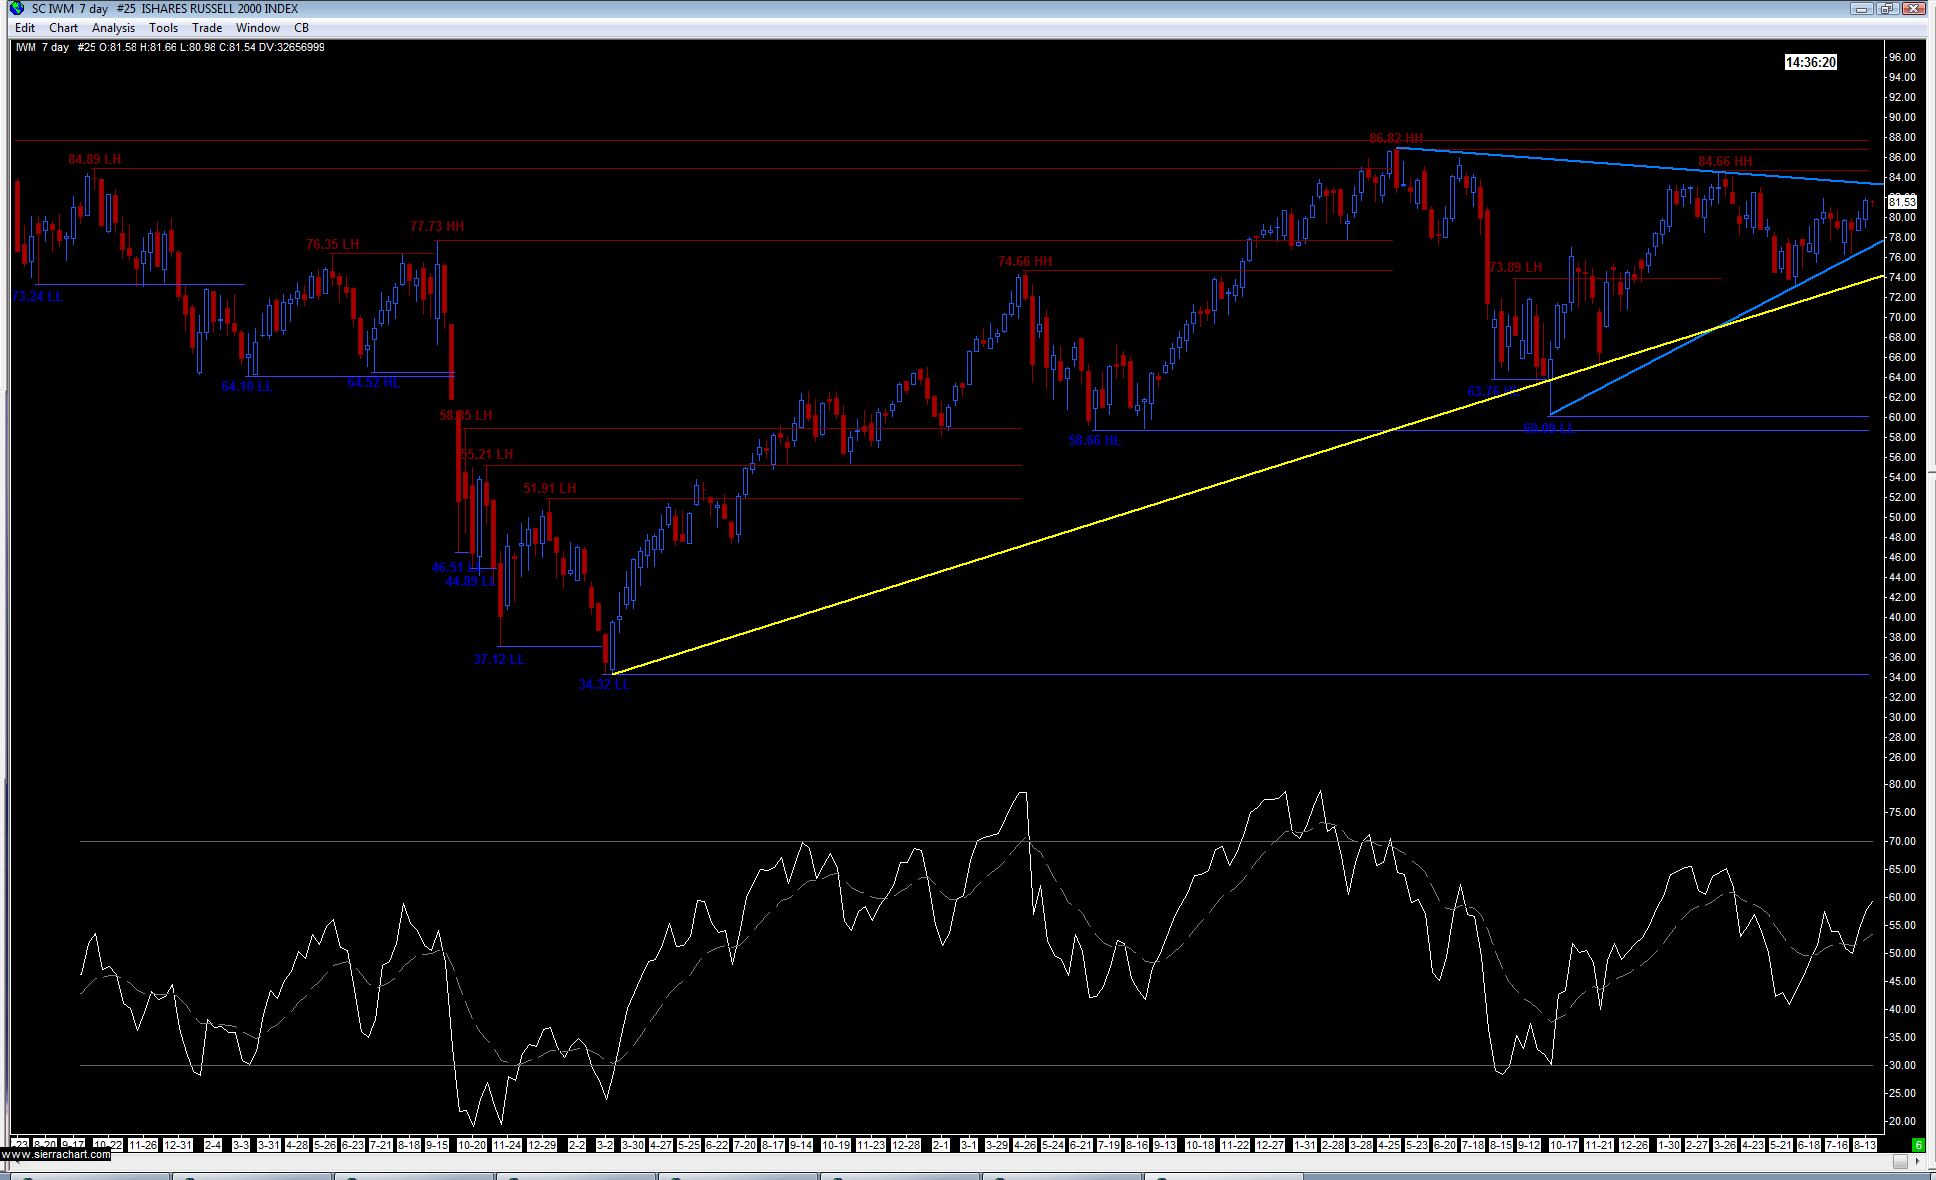
Apparently the Russell 2000 loves this deceptively bearish pattern built of an uptrend with many more Rising Wedges showing in the two-year daily chart below than the six distinct patterns that are marked.
Of greatest concern for this small cap index is the multi-month Rising Wedge that is working toward a fast fulfillment of its target of 602 through this years sideways trend comprised of multi-week Rising Wedges that will try to pull the Russell 2000 down toward 765 and 730, respectively. All such potential bearishness is fitting with the Russell 2000s more than year-long trend of lower highs, but it is important to note that this index did just start to officially reverse what had been a 6-month downtrend by its convincing close above the third Bull Fan Line marked in gray.
It seems unlikely, though, that this reversal will last too much longer with those three Rising Wedges calling for a nearly 30% decline that is supported by the multi-year H&S pattern that continues to present well in monthly form.
It, too, is supported by the Rising Wedges shown in the daily chart but most truly by the multi-year Rising Wedge born of QE1 and a pattern that promises to take the Russell 2000 down toward 350 with the last multi-year Rising Wedge having been quite successful as can be seen.
Relative to the competing bull case, its hard to fight gravity, but there is a chance of move up toward 930 on a monthly Pipe Bottom comprised of May and June and it confirms at 830. Interestingly, the Pipe Bottom itself presents well, but it is hard to see it beating the Russell 2000s trend of lower highs with the test resting at that patterns confirmation level of 830.
Above 830 and this will put the focus on the possibility of the Russell 2000 rising above this years high of 848 to truly dissolve its multi-year trend of lower highs, but below 830 and think about all of the Rising Wedges in the Russell 2000.