Welcome to NexusFi: the best trading community on the planet, with over 150,000 members Sign Up Now for Free
Genuine reviews from real traders, not fake reviews from stealth vendors
Quality education from leading professional traders
We are a friendly, helpful, and positive community
We do not tolerate rude behavior, trolling, or vendors advertising in posts
We are here to help, just let us know what you need
You'll need to register in order to view the content of the threads and start contributing to our community. It's free for basic access, or support us by becoming an Elite Member -- see if you qualify for a discount below.
-- Big Mike, Site Administrator
(If you already have an account, login at the top of the page)
First a 9 day profile showing the 1180 to 1230 ish range:
Now just the last 5 days, the weekly profile:
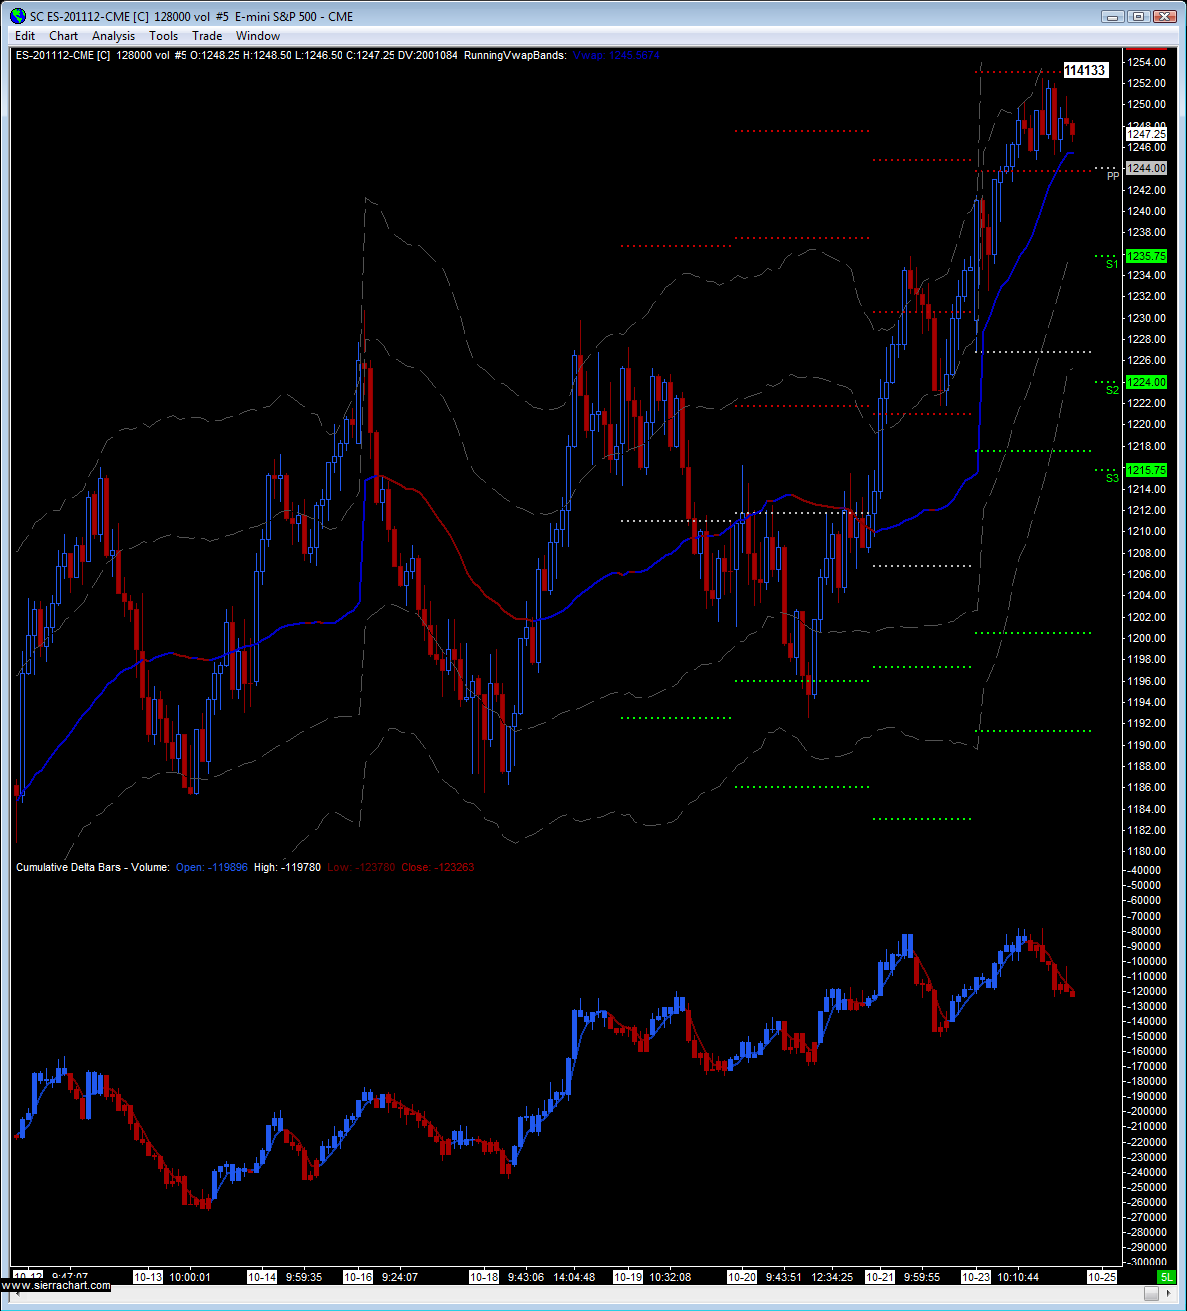
Areas of interest below:
1216 - 1220 (weekly pivot, VAH, s/r for thurs/fri)
1207 - 1208.50 (vpoc)
1201 - 1204 (weekly S1, s/r from thurs/fri and prior week, low volume zone)
1185 - 1189 (pw-low, major support, VAL)
Longer term players looking at a 240m or daily chart will only see support around 80-85, IMO.
For above:
I don't see anything really until 1252-1259. Projecting beyond that I would venture a guess at 1290, but it's really pointless to look there right now IMO; we need more information.
This type of move just emphasis time and time again how important it is to trade what you see in front of you. Don't let external influences give you too much bias one way or the other where you think the market is vastly oversold or overbought, and that influences your decisions. If you are an intraday trader or a short term trader not holding positions for weeks, then you should really focus on what is on your screen and not on what the talking heads are babbling about.
Everyone is always afraid to miss the next huge move, the next huge sell off, whatever. Trust me, if we see a huge correction in the market there will be plenty of time to get short. Let's at least first have the Daily and weekly charts trading below their monthly and weekly VWAP before we start going heavy short
Well, it is greatly appreciated. Thanks for the hard work and time and effort you put into the forum.
On an ES note, I did short the 52 as I had it as a resistance area in my chart. Unfortunately I accidentally closed half my position at BE (I don't recall doing it but I must have, as I looked down and saw that half my position was open). Then I got a little nervous, thinking that perhaps there was a problem with my broker connection so I closed the other half at BE as well. That would have been a nice counter trend down.
For the move up, I bought 40 at 10am, walked away for a few minutes with my stop at 39, and looked in horror as I came back to find price moving up without me. I sold the low tick of the retrace, and was too stunned to get back in. Add a couple of bonehead trades on top of that and it was a less than desirable day for me. But, there's tomorrow.
Well said! It's hard to do and takes a lot of mistakes to figure that out. At least for me it did.
I'm still long after buying 2 lots at 1235 and dumping one at 1248.
stop set below 1240 to absorb any London selling. We'll see...
I may look to short at 1238 if price decides to go that way
around 6:15am Pacific time.
Nice charts Josh. Love the low volume areas in the profile as pivot potential.
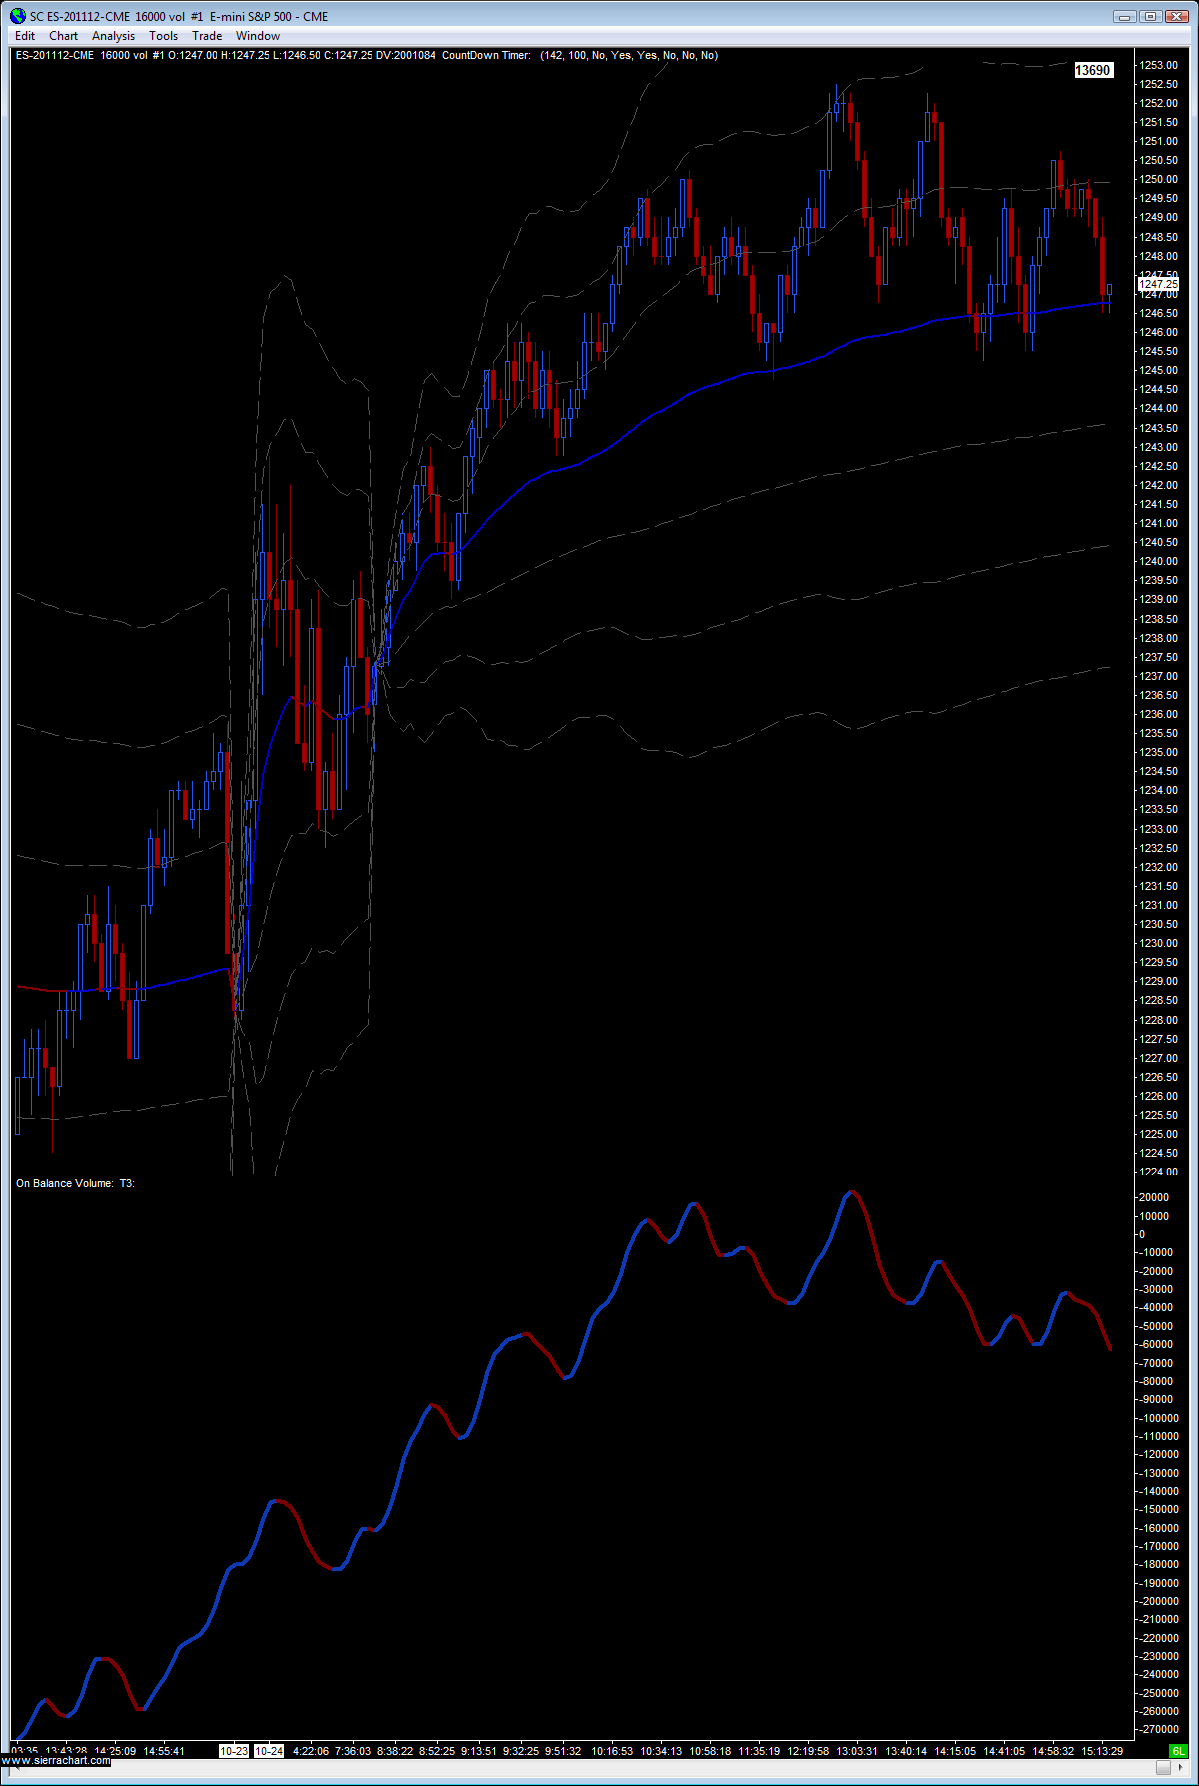
Thanks Massive -- what is the blue line on your chart?
Mike, how are you liking OBV? I have been tempted on more occasions than I can recall to use volume charts, however what gets me every time is that I use volume in my analysis, and this eliminates volume as a variable I have used a simple "time per bar" indication as well, but it's just not the same.