Welcome to NexusFi: the best trading community on the planet, with over 150,000 members Sign Up Now for Free
Genuine reviews from real traders, not fake reviews from stealth vendors
Quality education from leading professional traders
We are a friendly, helpful, and positive community
We do not tolerate rude behavior, trolling, or vendors advertising in posts
We are here to help, just let us know what you need
You'll need to register in order to view the content of the threads and start contributing to our community. It's free for basic access, or support us by becoming an Elite Member -- see if you qualify for a discount below.
-- Big Mike, Site Administrator
(If you already have an account, login at the top of the page)
I am using and testing this indicator created by FatTails anaUserDefinedLines.
I am presently using it in an indicator panel on a tick chart. For example on the ES, i want to get an alert when price forms a bar of at least 1.5 point on a 800 ticks chart. It works as expected except there is a line that displays at the 0 level in the indicator panel. This is not a problem but i wanted to point this out. Also, i noticed that the plots section does not order the various alerts as they are for the other two sections: User defined labels and User defined values. The first alert is defined in row 1 of the User defined labels section (Label01) and User defined values section (Value01) while the corresponding alert is found in the last row of the Plots section. Again, this is not a problem. I just wanted to point this out.
Some suggestions:
I find 20 lines is too many lines. 5 lines would be more appropriate since we can add many instances of this indicator on the same chart.
Would it be possible to have a version where we could define a few moving averages instead of fixed price levels? When price would cross a MA, an alert would be triggered.
This is a bug, I had used Reset() for 19 out of 20 lines, but for the second label I had erroneously used Set(0) which produced the line.
The order of the plots section follows that NinjaTarder logic -> Plots[0], Plots[1], Plots[10], Plots[11] .... Plots[2] etc. Problem should be solved, because I reduced the number of lines to 10.
Reduced.
That would be a different indicator.
The updated indicator is here: Zeroline will no longer show up, number of lines reduced to 10.
Thanks for this , not sure why but not playing sound (have sound alert active true and levels set
also was wondering if it would be possible to have a different sound at different levels
Thanks for all you do
"Successful trading is one long journey, not a destination" Peter Borish Former Head of Research for Paul Tudor Jones speaking on conversations with John F. Carter
Checked the alerts, they work. You need to locate a .wav/PCM file in the NinjaTrader sounds directory and select the file name via indicator dialogue box. The default file is Alert4.wav.
It is possible to have different sounds at different levels. Maybe will add this with the next release, as this more sort of a toy thing.
1). I like the 20 Lines feature.However I tried plotting this indicator on GOMI's CD but it does not plot negative numbers. I put -10000 but it did not plot these numbers only the positive ones such as 10000, 20000 etc.
2)I tried installing new version I got 'Error plotting indicator 'anaUserDefinedLines'. Please check the 'OnBarUpdate' or the Plot' method: Index was outside the bounds of the array.
(1) The indicator does plot negative values, I do not know, where problem lies.
(2) The indicator is pretty straight forward. It should not throw any exceptions. If you can reproduce the problem, I would like to have a look at your log file.
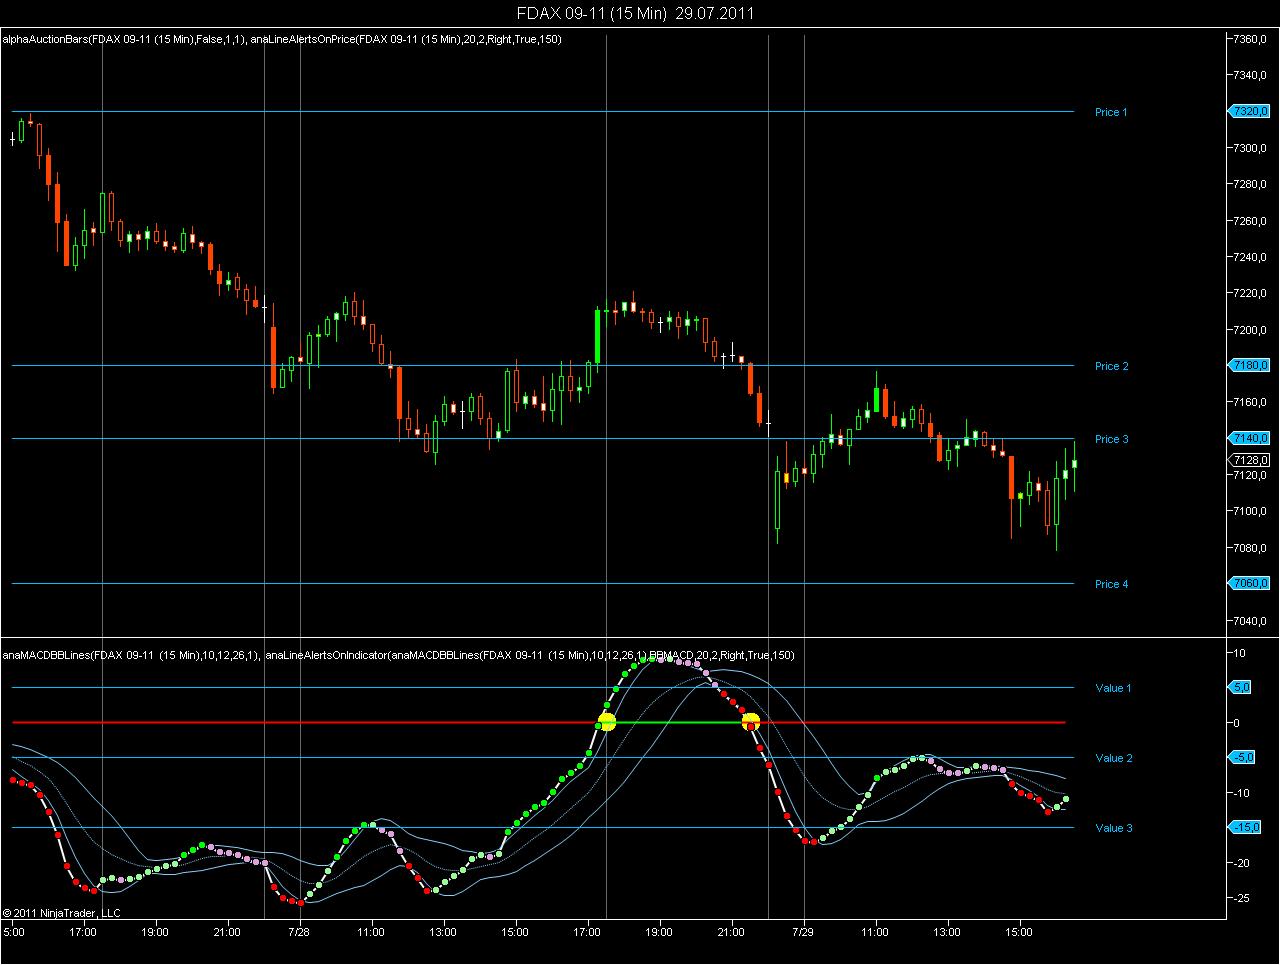
The indicator was designed for plotting lines at the price panel. If you use it on the indicator panel, it can not trigger the alerts as expected, as it uses the TickSize to define the alert zone. I will modify the indicator and come back with a version that will also trigger alerts on the indicator panel.
Following your suggestions I have now added a second version of the indicator that can be applied to indicators.
If you want to be alerted to a value on the main price panel
-> please use anaLineAlertsOnPrice
However, if you want to be alerted to a specific indicator value
-> please use anaLineAlertsOnIndicator
There are two differences between those two indicators:
(1) anaLineAlertsOnPrice will automatically show up on the price panel, anaLineAlertsOnIndicator requires that you select the panel manually where it will be plotted.
(2) anaLineAlertsOnPrice uses ticks to calculate the offset for the price alerts, anaLineAlertsOnIndicator uses units which are calculated from the volatility (price-to-price changes) of the indicator, as the notion of the ticksize does not make sense when applied to an indicator.