NexusFi: Find Your Edge


Home Menu


Indicator plotting time in the volume based charts or volume delta charts.


Discussion in Traders Hideout

Updated
      Top Posters
    1. looks_one Czechmade with 2 posts (0 thanks)
    2. looks_two DavidHP with 1 posts (0 thanks)
    3. looks_3 Big Mike with 1 posts (0 thanks)
    4. looks_4 Quick Summary with 1 posts (0 thanks)
    1. trending_up 4,508 views
    2. thumb_up 0 thanks given
    3. group 2 followers
    1. forum 5 posts
    2. attach_file 1 attachments


Search this Thread
  #1 (permalink)
 Czechmade 
Silverthorne, CO
 
Experience: Beginner
Platform: Investor RT
Broker: DTN IQ feed
Trading: ES
Posts: 20 since May 2010
Thanks Given: 4
Thanks Received: 5

Indicator plotting time in the volume based charts or volume delta charts. Does anybody know if there is a way to plot time under the chart in chart where each bar is plotted by volume or delta volume? For example each bar is created when 1000 contract traded or 500 delta volume traded...but I want to know how long it took for this bar to get created.
Thanks


Started this thread Reply With Quote

Can you help answer these questions
from other members on NexusFi?
Four New E-mini Futures Launch June 29 -- Russell 3000, …
Emini and Emicro Index
The June 15 Resolution Trap: Irans Agreed Text Still Pri …
Prediction Markets & Event Contracts
Roland Garros Final Day: $3M on Zverev at 80.5% -- Leban …
Prediction Markets & Event Contracts
Beijing Summit Closes: Xi Pledges Hormuz Help -- $1.14B …
Prediction Markets & Event Contracts
US Prop Firms Race Inside the CFTC Perimeter -- Tradeify …
Funded Trading Evaluation Firms
 
Best Threads (Most Thanked)
in the last 7 days on NexusFi
NexusFi site changelog and issues/problem reporting
15 thanks
Darmok and Jalad at Tanagra
3 thanks
30 Sessions
1 thanks
Big Mike in Ecuador
1 thanks
  #3 (permalink)
 
Big Mike's Avatar
 Big Mike 
Manta, Ecuador
Site Administrator
Developer
Swing Trader
 
Experience: Advanced
Platform: Custom solution
Broker: IBKR
Trading: Stocks & Futures
Frequency: Every few days
Duration: Weeks
Posts: 50,669 since Jun 2009
Thanks Given: 33,669
Thanks Received: 102,577


Czechmade View Post
Indicator plotting time in the volume based charts or volume delta charts. Does anybody know if there is a way to plot time under the chart in chart where each bar is plotted by volume or delta volume? For example each bar is created when 1000 contract traded or 500 delta volume traded...but I want to know how long it took for this bar to get created.
Thanks

You didn't put this in a specific platform subforum, so we need to know what platform you are talking about.

Mike


We're here to help: just ask the community or contact our Help Desk

Quick Links: Change your Username or Register as a Vendor
Searching for trading reviews? Review this list
Lifetime Elite Membership: Sign-up for only $149 USD
Exclusive money saving offers from our Site Sponsors: Browse Offers
Report problems with the site: Using the NexusFi changelog thread
Follow me on X Visit my NexusFi Trade Journal Reply With Quote
  #4 (permalink)
 
Goldstone15's Avatar
 Goldstone15 
Los Angeles, CA
 
Experience: None
Platform: NinjaTrader
Trading: CL ES
Posts: 239 since Jul 2012
Thanks Given: 49
Thanks Received: 188

Is it not plotted on the x-axis?


Before you attempt to beat the odds, make sure you can survive the odds beating you.
Reply With Quote
  #5 (permalink)
 Czechmade 
Silverthorne, CO
 
Experience: Beginner
Platform: Investor RT
Broker: DTN IQ feed
Trading: ES
Posts: 20 since May 2010
Thanks Given: 4
Thanks Received: 5

I am not sure if anybody thought about this before, so if it was discussed in different thread, excuse me. The concept I have in mind goes like this. If I look at the chart with the timeframe controlled by delta volume ( in Sierra chart it is called delta volume by bar), it becomes obvious that it will take different time for each bar to get created. Since the delta volume reflects the market driven orderflow, I assume that bars that got created faster are the ones that reflect urgency....therefore it can be beginning of momentum. And the bars that needed more time to be created lack this urgency. So I am interested in those bars and go in the same direction that were created quickly.
Another thing is volatility of these bars. If there is a bar that was formed quickly and has rather large volatility, it means that there is also no resistance in the orderbook (limit orders) which would absorb the market driven orderflow (volume delta).

I would like to hear from anybody interested in developing this idea. Iam sure this is just the small step.


Dont know how to post a pic


Started this thread Reply With Quote
  #6 (permalink)
 
DavidHP's Avatar
 DavidHP 
Isla Mujeres, MX
Legendary Market Wizard
 
Experience: Advanced
Platform: NinjaTrader
Broker: Ninjatrader / Optimus Futures / AmpFutures
Trading: NQ / ES / 6E / 6B / CL
Frequency: Every few days
Duration: Minutes
Posts: 1,817 since Aug 2009
Thanks Given: 11,767
Thanks Received: 3,043

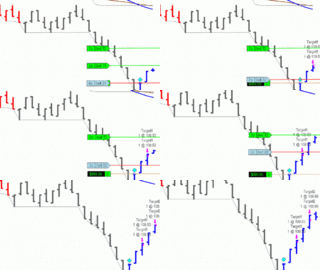
Maybe this is what you are seeking?

This 1000 Volume bars with an indicator called virtual bars.

The virtual bars are set for a time of 5 minutes.
They can be adjusted to any time period or volume or number of bars.

They were posted in this thread some time ago.


Rejoice in the Thunderstorms of Life . . .
Knowing it's not about Clouds or Wind. . .
But Learning to Dance in the Rain ! ! !
Follow me on X Reply With Quote


Last Updated on November 8, 2012


© 2026 NexusFi®, s.a., All Rights Reserved.
Av Ricardo J. Alfaro, Century Tower, Panama City, Panama, Ph: +507 833-9432 (Panama and Intl), +1 888-312-3001 (USA and Canada)
All information is for educational use only and is not investment advice. There is a substantial risk of loss in trading commodity futures, stocks, options and foreign exchange products. Past performance is not indicative of future results.
About Us - Contact Us - Site Rules, Acceptable Use, and Terms and Conditions - Downloads - Top
no new posts