NexusFi: Find Your Edge


Home Menu


How big to make the boxes?


Discussion in Traders Hideout

Updated
    1. trending_up 2,992 views
    2. thumb_up 3 thanks given
    3. group 2 followers
    1. forum 2 posts
    2. attach_file 0 attachments


Search this Thread
  #1 (permalink)
 mcteague 
New York NY USA
 
Experience: Intermediate
Platform: esignal, thinkorswim,
Trading: Stocks
Posts: 122 since Oct 2012
Thanks Given: 63
Thanks Received: 35

First let me say that just thinking about asking this question makes me feel like an idiot. But I think it is a legitimate concern, especially for beginners. So here goes.

When you look at an indicator, like MACD for example, people will tell you that sharp strong signals are what matter. Like a cross of the zero line or signal line. You want it to occur at a sharp angle. And probably want to ignore weak crosses. When we look at price itself we are told that it is best to look for strong trending markets. You know where is price is going up or down and a clear strong steady angle. This is true and great. But here's the problem.


The angle of all the lines in all your charts. ( price, indicators, etc) is completely dependent on the shape of the box it is in. By shape; we mean the horizontal and vertical scale of the box. If you re-size your charts right now by increasing or decreasing the horizontal space, you can make trends and strong indicator signal appear and disappear like magic.

So how would anyone know, based on a visual analysis of the data, that they had shaped their charts in the optimal proportions to get the best signals and not have completely wrong ones because the box is the wrong shape?
Are there optimal scales that are known?


Started this thread Reply With Quote
Thanked by:

Can you help answer these questions
from other members on NexusFi?
Iran Airspace Collapses 18 Points to 15.5% While Hormuz …
Prediction Markets & Event Contracts
Fabrication or Framework? Irans Denied MOU Explains the …
Prediction Markets & Event Contracts
Memorandum Watch: How the 60-Day MOU Framework Makes May …
Prediction Markets & Event Contracts
Hormuz Normalization Collapses to 19.5% -- Iran Regime F …
Prediction Markets & Event Contracts
Iran Fired a Missile at Israel Last Night. The $8M June …
Prediction Markets & Event Contracts
 
Best Threads (Most Thanked)
in the last 7 days on NexusFi
NexusFi site changelog and issues/problem reporting
15 thanks
Darmok and Jalad at Tanagra
3 thanks
Big Mike in Ecuador
1 thanks
30 Sessions
1 thanks
  #3 (permalink)
 
wldman's Avatar
 wldman 
Chicago Illinois USA
Legendary Market Wizard
 
Experience: Advanced
Broker: IB, ToS
Trading: /ES, US Equities/Options
Frequency: Several times daily
Duration: Hours
Posts: 3,585 since Aug 2011
Thanks Given: 2,095
Thanks Received: 9,704


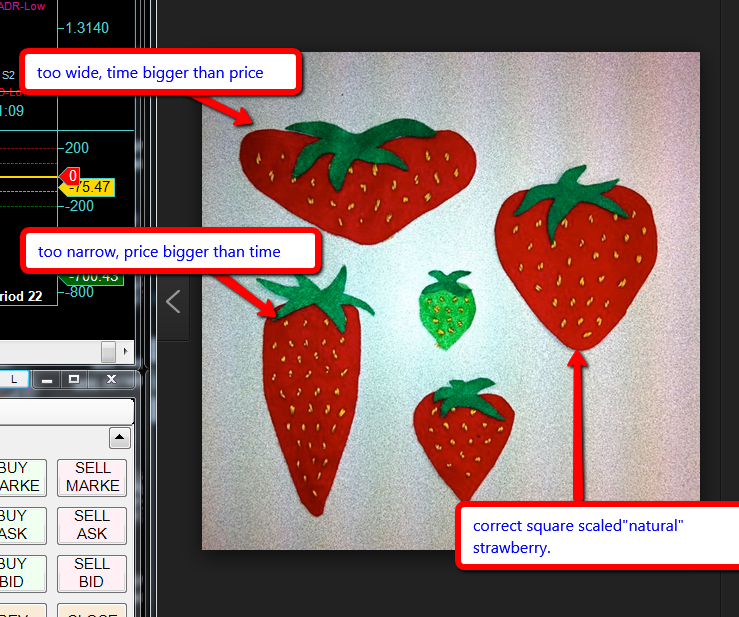
but vendors do not care. What you are describing is a square scaled chart where time and price or ticks and price are treated the same visually.


This picture describes the basic idea.


Visit my NexusFi Trade Journal Reply With Quote
Thanked by:


Last Updated on September 5, 2013


© 2026 NexusFi®, s.a., All Rights Reserved.
Av Ricardo J. Alfaro, Century Tower, Panama City, Panama, Ph: +507 833-9432 (Panama and Intl), +1 888-312-3001 (USA and Canada)
All information is for educational use only and is not investment advice. There is a substantial risk of loss in trading commodity futures, stocks, options and foreign exchange products. Past performance is not indicative of future results.
About Us - Contact Us - Site Rules, Acceptable Use, and Terms and Conditions - Downloads - Top
no new posts