Welcome to NexusFi: the best trading community on the planet, with over 150,000 members Sign Up Now for Free
Genuine reviews from real traders, not fake reviews from stealth vendors
Quality education from leading professional traders
We are a friendly, helpful, and positive community
We do not tolerate rude behavior, trolling, or vendors advertising in posts
We are here to help, just let us know what you need
You'll need to register in order to view the content of the threads and start contributing to our community. It's free for basic access, or support us by becoming an Elite Member -- see if you qualify for a discount below.
-- Big Mike, Site Administrator
(If you already have an account, login at the top of the page)
I have a strategy developed with Multicharts using DTN IQFEED data (they offer a very big database of datas and of course you pay a lot for it) and today I simply tried to apply the same strategy over the same instrument (the DAX FUTURE) but just with CQG data ( that I'm going to use on a VPS as datafeed and for order routing). I 've been very surprised to see so much difference into the backtest results. On IQ feeed I'm using the XG# continuous contract and on CQG I'm using the DDM19 contract (because they don't offer the continuos contract or I'm unable to find it).So Here there are the last 2 month of daily operations simulated with multicharts (on the left you have IQFEED and on the right you have CQG). How's possible to have such a difference?
My strategy analize how the price arrive to a level by checking some previous bar shapes over 5 minutes bar and 2 minutes bar.
I checked the chart with the TIME BASED candles with 5 min and 2 min and IQFEED and CQG are almost IDENTICAL. Only if I try a resolution of for example150 contract then charts are VERY different.
Anyway my strategy is using only time based bars so I'm unable to understand such a difference.
Of course I can set up multichart to use IQFEED as data feed and send Order throw CQG, but by this way I'll spend 140$/m for IQdatafeed when I'm already paying CQG for the same ( and I cannot use IQFEED data with my other computer for studies and backtest).
Any ideas? Is anyone experienced something like this?
Can you help answer these questions from other members on NexusFi?
"almost IDENTICAL" is one thing... "ALMOST identical" is another.
Some things to check:
The important ones are noted with **... the rest are sanity checks to distract you while you are pulling your hair out.
- MC has an option for a data source to build minute resolution charts using minute based data. Maybe if you enable this setting, for both IQ and CQG, you'd then note other differences in backtest results, or maybe the results would be more in line with each other.
- **Add console debug statements for evey bar close calculation, print out the bar number, the time, O/H/L/C prices, and all relevant variable values from your trade entry and exit decision logic.
- **zoom in on a chart to a time location for one of the trades, that either was not entered on the other chart -- or that resulted in a different exit or profit/loss result.
- **Carefully examine your debug output for each. If you spot any differences, re-check your strategy logic to see how it might be affected by the differences. You should be able to see exactly why one strategy passed up an entry or an exit that was taken on the other chart. If you can identify the cause in just one of these cases, it usually will point you to the answer you seek.
- As you say, you are using a continuous symbol for one feed, and a single contract on another. It might help you to know whether some of the issues you are seeing are happening on or before the rollover date.
- Try the same comaprison test again, but use the June Dax on IQ Feed to compare with. At least then you are comparing apples to apples, (even though I agree, one might believe the continuous contract would be close enough after the most recent roll date.)
- Check the chart settings on each chart. The contract session time might be different between. This could cause a bar to be missed here or there.
- Double-check that limit order entries or exits are being triggered the same way on both chart strategies. (they should be...)
- Reload the data for both feeds to be sure you are only using historical data.
- dump the data for a given day, for each symbol into a CSV file. Put them up in an editor side by side. Examine all the OHLC prices numerically one by one...are they different?
I would suggest checking your data first, as this is most likely one cause for differences. Check how different the number of bars on the chart and prices actually are.
When you compare an individual contract to a continuous contract especially during a time when a different contract was the front month, you are likely comparing different data and I would expect to get different results based on that data.
@ocpb has given you great points to look at. You will have to carefully examine the internal computations within your code and the underlying data it uses, as this should give you clues about the possible cause of differences.
Hello Everyone and thanks for the great list of suggestions.
I will, of course, investigate further to this matter but at the moment I think that after have spent a lot of time developing, backtesting and real time simulating this system JUST TO BE SURE I think I'll use my IQFEED data to trigger entries and not CQG (I'll use it just for orders).
Anyway... I checked the datas comparing 2 DAX charts with 150 contract resolutions ( so volume based charts ) and they were completely different.. that doesn't surprise me a lot because volumes are always different between datafeeds...
Then I compared the time based charts and they are the SAME. So I still do not understand why should I have such a difference in entries. If you think OHLC are the same.. and my strategy simply use H , O, L and C and a manipulations of its values... Really a mistery.
Please look at TODAY!
IQFEED (as it should be or at better " what it should do by following my system rules ")
CQG
CHART SETTINGS:
As you know if you have chart open in multicharts by clicking CTRL + SHIFT + C you can COPY the entire chart with all it's setting and indicator and whatever. Then I just pasted the chart in a new workspace and then I've simply changed the instrument from iqfeed XG to DDM19 of CQG so the settings are the same 100%.
About the differencies between the continuos contract of IQFEED and the regular one of CQG June19 As you can see in the images above the values are the same.. I don't think they change in this period... but just close to the expire date.
debug the internal values of your strategy that you compute to trigger orders for the bars that show differences and track down what causes them.
It might also make sense to ensure that both strategies use the exact same number of bars over the entire test set (!) and both using the current front month for both, to rule out differences due to the continuous contract using different front month over your test period. Also make sure that both symbols use the correct symbol settings and session times in Quote Manager.
Without knowing your code one could only guess what is going on, as there are probably countless possibilities and even a small difference at one point can impact the entire remainder of a test (for example code that reacts to past system performance, a start point dependency of code parts - for example when you use an exponential average etc.).
I can see that the charts are *not* identical -- the 5 min charts look good, but the 2 minute bars boundaries are not aligned with the 5 min bars in the same way on both screenshots. (see ~10:00 for a clear example). If you rely on both data series for your strategy, this could be a likely reason for getting different backtests.
I know you copy/pasted to create these, but when you edit an instrument symbol, MC may at that point reset to some default values. So check the "break on session" checkbox, the session times, chart dates, etc.
This may sound a little obvious but have your tried using specific contracts for each data feed.
Hence not using any continuous contracts with either data feed.
I'd break it down to a day at a time and try to work out where the differences are.
For example: Start each chart at the same time, preferable a new week, after 1 hour of data collection compare the variables you look at and need, hence: price bar OHLC, volume and delta of each bar, ideally they should be the same.
If they are not you can export this information to excel and then get excel to highlight any differences between the 2 data sets.
If you do this for 1 day and then crosscheck with the exchange hence EOD volume etc you should in theory see if there is a difference between the 2 data sets and the exchange.
If you contact the exchange they may also be able to give you some information.
I had a few issues with DTN IQFeed whereby they had a stuck bid and it took them a while to fix the dataset, this has occurred on numerous occasions. This may happen from time to time as the datafeeds have issues for whatever reason.
I'd try to isolate the components in order to find the difference.
I hope that helps.


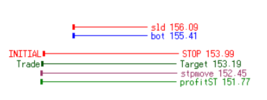 I don't explain my charts. If you like to follow my trades, look for these lines.
