Hi
scalpers,
hope I can find some of you gus with a little time for this to help verify what happened.
Reasons apart, also would like to trade from
HTF, but I'm a
scalper. Silent (as I post so few) but constant.
Using:
NT 7.0.1000.39, with Continuum data feed (
Ninjatrader brokerage)
Windows 10 64 bit on i7-7700 CPU 3.6Ghz with 16Gb RAM
100Mbs interent download, 20ms ping
Chart at EAST US Time zone.
I am Nt8 nearly ready, just missing this exactly 10 seconds market profile configuration, that seems impossible.
The case is that real time trading I have a picture of a 10 seconds NQ 06-19 chart, that is different from the one you can take afterwards from historical data.
From price 7304 at 8:50:20 to 7335 at 8:53, you can see pictures differ. The 10 seconds bars paint differently, touching different price ranges.
First my real time picture, first one send to support:
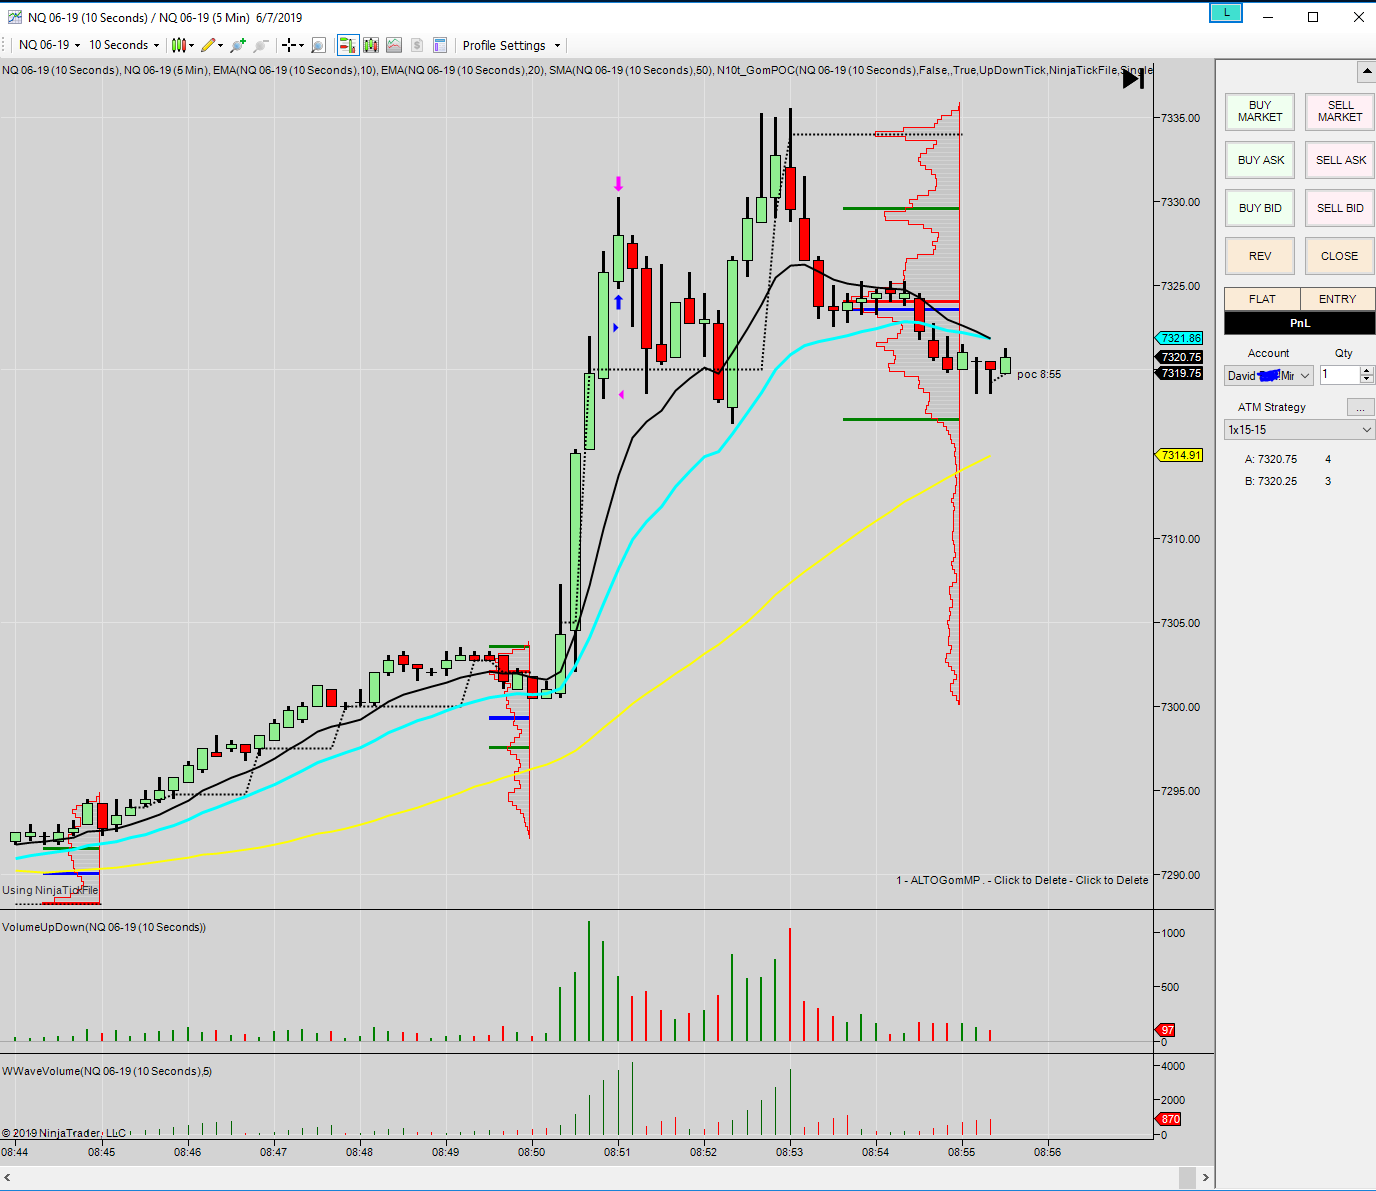
That for me demonstrates what I lived yesterday in front of my 10 year old screens:
I was using a Nt strategy for 1
contract, 15 ticks sell limit and 15 ticks stop mkt sell bracket orders.
I placed a stop buy
limit order at 7322.75 to buy 1 tick lower, at 7322.50. I then get filled as blue arrows shows but I remember NT was still painting on previous bar. Important for them if they want to investigate.
And i could see price trading outside the bracketed placed orders, well above, both target sell and stop sell were there.
What happened is that I already saw that in the past, but is kinda difficult to explain. As I saw price well beyond my sell limit, above it, in my favour, I hit the close button to be sure I had a winning trade and both those bracketed orders out there (both below price) got reset-out.
To my surprise I got a very bad fill on my close, something that looks as impossible, but you can see on the 10 seconds chart I was working with, that the price NT filled my close action with, never happened until more than 10 seconds after my close button hit, and I can remember very well as astonished as I was.
Exactly, when I hit the close button, NT was painting on the bar next where the sell arrow is.
Again, all this is from the chart picture that I lived real time yesterday.
Second, the historical chart you can take:
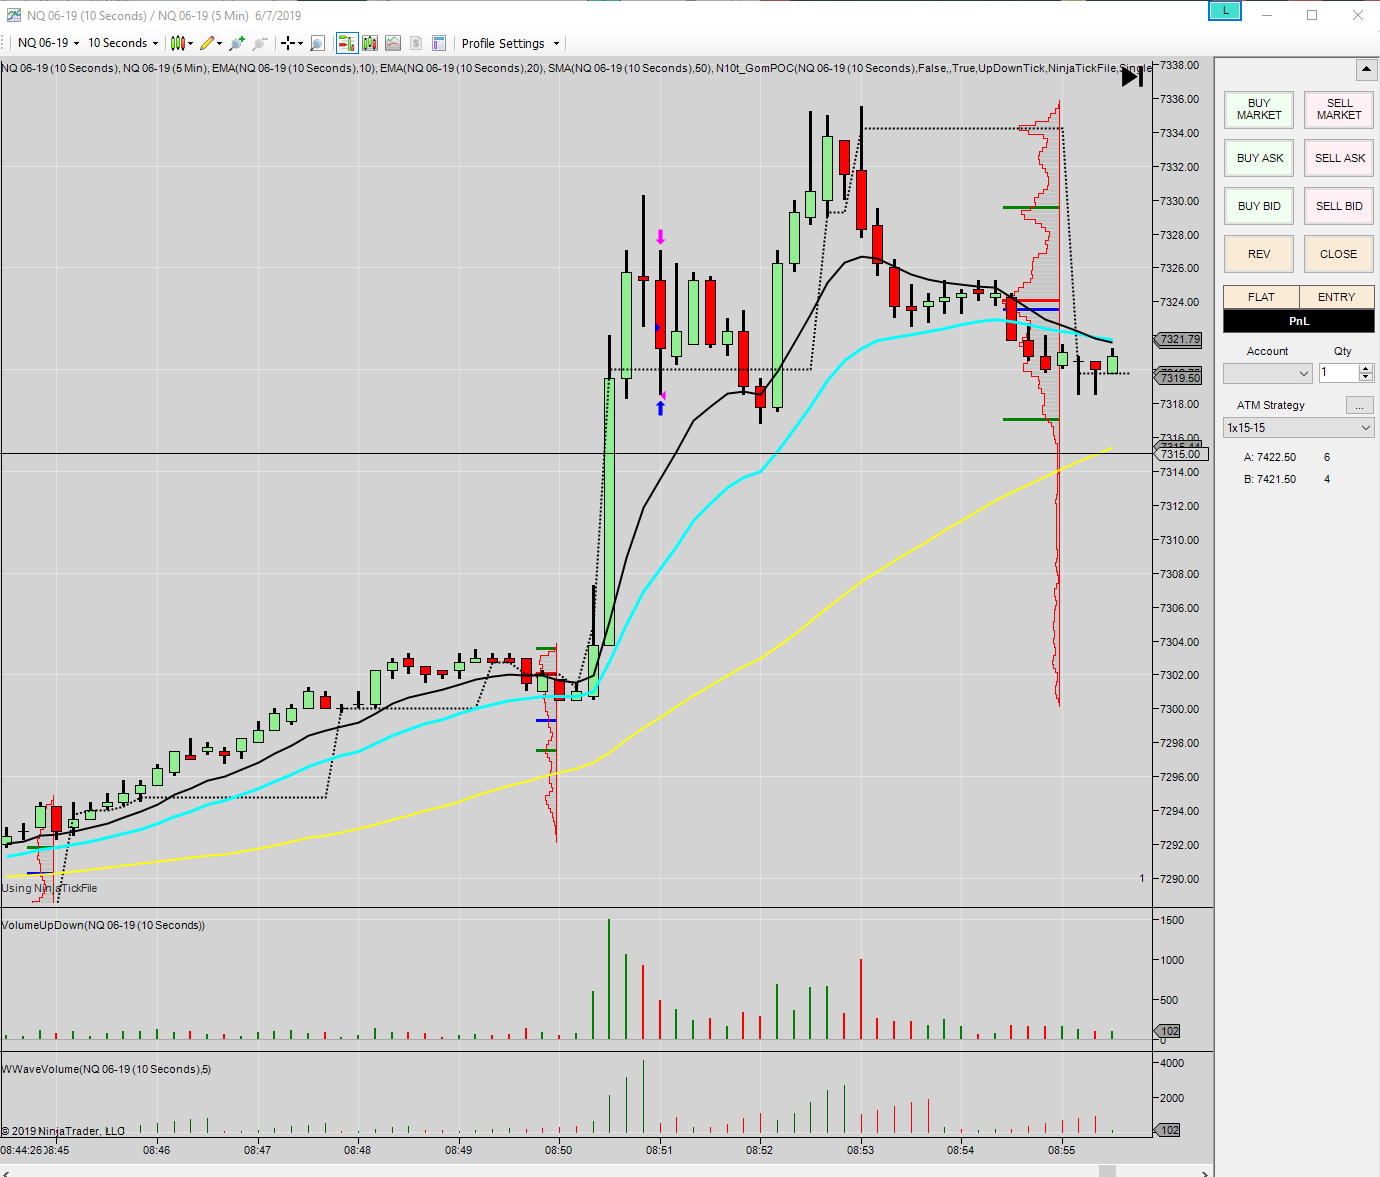
Obviously from the historical chart and log and trace files everything looks clear and against me.
Summarized details from log:
2019-06-07 08:50:54:786 7322.5 buy
2019-06-07 08:50:59:184 7318.5 sell stop
But my charts at that time weren't saying that.
Who cheated me Ninjatrader?
Scalper or experience details.
Emotionally I knew that that problem at the beginning of the session could damage me a lot, but I managed to continue trading and focused in. Clarify that ended day with only 350$ profit on 18 trades (too much). I am not that emotional against NT for that trade. Though it represents a minimal -160$ on my trades yesterday, that I still claim for.
I am very angry for this NT software behaviour.
I think this is a big annoying problem and has to be investigated.
I asked NT to explain:
1. Real time 10 seconds chart is so different as historical one.
2. If entered long in mkt with my real time picture (what I really lived) with a 15 ticks strategy limit sell, should have had a winner. Even slipped in favour. Why didn't the sell limit trigger if price was painting bars above that?
3. If I hit the CLOSE button when I see 10 seconds bars above my limit sell, so to have a sure winner, how can I be filled more than 30 ticks lower??
So guys, my questions for you:
do you have possibility to take a picture of similar time frames with other software? sierra?
different data feeds?
would some
order flow historical list data help on that? anyone with tools?
Have you faced similar problems? I can assure you this is not the first time to me.
Glad to be part of the community, and thank you
all in advance.


