Welcome to NexusFi: the best trading community on the planet, with over 150,000 members Sign Up Now for Free
Genuine reviews from real traders, not fake reviews from stealth vendors
Quality education from leading professional traders
We are a friendly, helpful, and positive community
We do not tolerate rude behavior, trolling, or vendors advertising in posts
We are here to help, just let us know what you need
You'll need to register in order to view the content of the threads and start contributing to our community. It's free for basic access, or support us by becoming an Elite Member -- see if you qualify for a discount below.
-- Big Mike, Site Administrator
(If you already have an account, login at the top of the page)
Lots of useful information. I had the range on the ES for today as 1007.75 - 1001.00. So that is coming along also. How do you like the projections so far? Thanks,
Thanks David, you are right there is something wrong with the wavelet code now. Sorry, should have tested it before I posted but I don't remember changing anything since the last time I used it
I will check it out and post an updated version soon
BTW.. have you read that entire thread on optimized trend trading? I read through it a while back. It is quite hilarious really, when CB is exposed =p
He is a smart guy and most of his advice is still relevant IMO, but be aware that he is a vulture. He lures other traders with original ideas into to collaborating with him and then steals their work, there are several posts about him on TSD forum from guys who got burned, sad really considering that he is smart enough to figure it out on his own.
Yes I saw that and also I think his equity curves are very suspect too.
However the signal processing concepts discussed there are very informative , although mostly way over my head.
I'm starting to think that a DSP approach is the golden key to automated system design. In fact I was talking to a friend over the weekend who is the technical guru behind a high frequency trading team. He was emphasising the importance of utilising noise rejection techniques and statistical probabilities, although they see a major decay in expectancies beyond a one tick horizon.
Very nice stuff. Are the numbers on the left axis correct for the next year prediction since it shows 1010 as top and 980 as bottom, but you said it is a big drop?
wh are you working with the files from bearcave.com? I tried your indicator but doesn't look like its drawing correctly here.
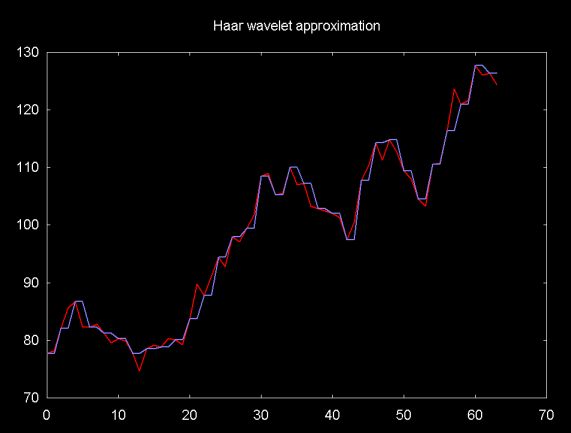
I just posted the fixed version of my wavelet kit, also a screenshot of it.. both are attached to the original post
Here are a few other screenshots showing it with different settings.
Again, *BE CAREFUL* with this indicator.. you really need to understand what you are doing to some extent to use it safely. Changing the settings can completely change the behavior of the indicator, or could change it in more subtle ways that are not immediately obvious if you don't know to look for them. For instance, changing basis functions can invert the signals (use scaling parameter to correct) or you could get edge effects from using improper boundary conditions (safer to stick with reflection unless you have a reason not to).
Although you can do a few interesting things with the indicator in the state that its in, to do anything really interesting with wavelets you will have to do a bit of research to figure out how to apply them. There are many interesting things you can do, denoising, cycle extraction and extrapolation, change point detection, pattern detection, compression, etc..


 Regards, NMTrader