NexusFi: Find Your Edge


Home Menu


Volume profile data


Discussion in NinjaTrader

Updated
    1. trending_up 2,553 views
    2. thumb_up 0 thanks given
    3. group 3 followers
    1. forum 1 posts
    2. attach_file 1 attachments


Search this Thread
  #1 (permalink)
Boreale
Montreal Canada
 
Posts: 1 since Oct 2020
Thanks Given: 0
Thanks Received: 0

Is the IB data ok for volume profile? I hear a lot of people advising against it but why specifically?


Reply With Quote

Can you help answer these questions
from other members on NexusFi?
Victory Day Delivers: Russia-Ukraine Ceasefire Market Cl …
Prediction Markets & Event Contracts
Fabrication or Framework? Irans Denied MOU Explains the …
Prediction Markets & Event Contracts
El Clasico Draws $9.2M in Prediction Market Action -- Bi …
Prediction Markets & Event Contracts
World Cup Opens: USA at 45.5% Tonight as Markets Push Ba …
Prediction Markets & Event Contracts
$500M Riding on World Cup 2026: France/Spain Co-Favored …
Prediction Markets & Event Contracts
 
Best Threads (Most Thanked)
in the last 7 days on NexusFi
NexusFi site changelog and issues/problem reporting
8 thanks
Darmok and Jalad at Tanagra
1 thanks
  #2 (permalink)
 
InvestiQuant's Avatar
 InvestiQuant   is a Vendor
 
Posts: 13 since Aug 2016
Thanks Given: 2
Thanks Received: 12


Hi Boreale,

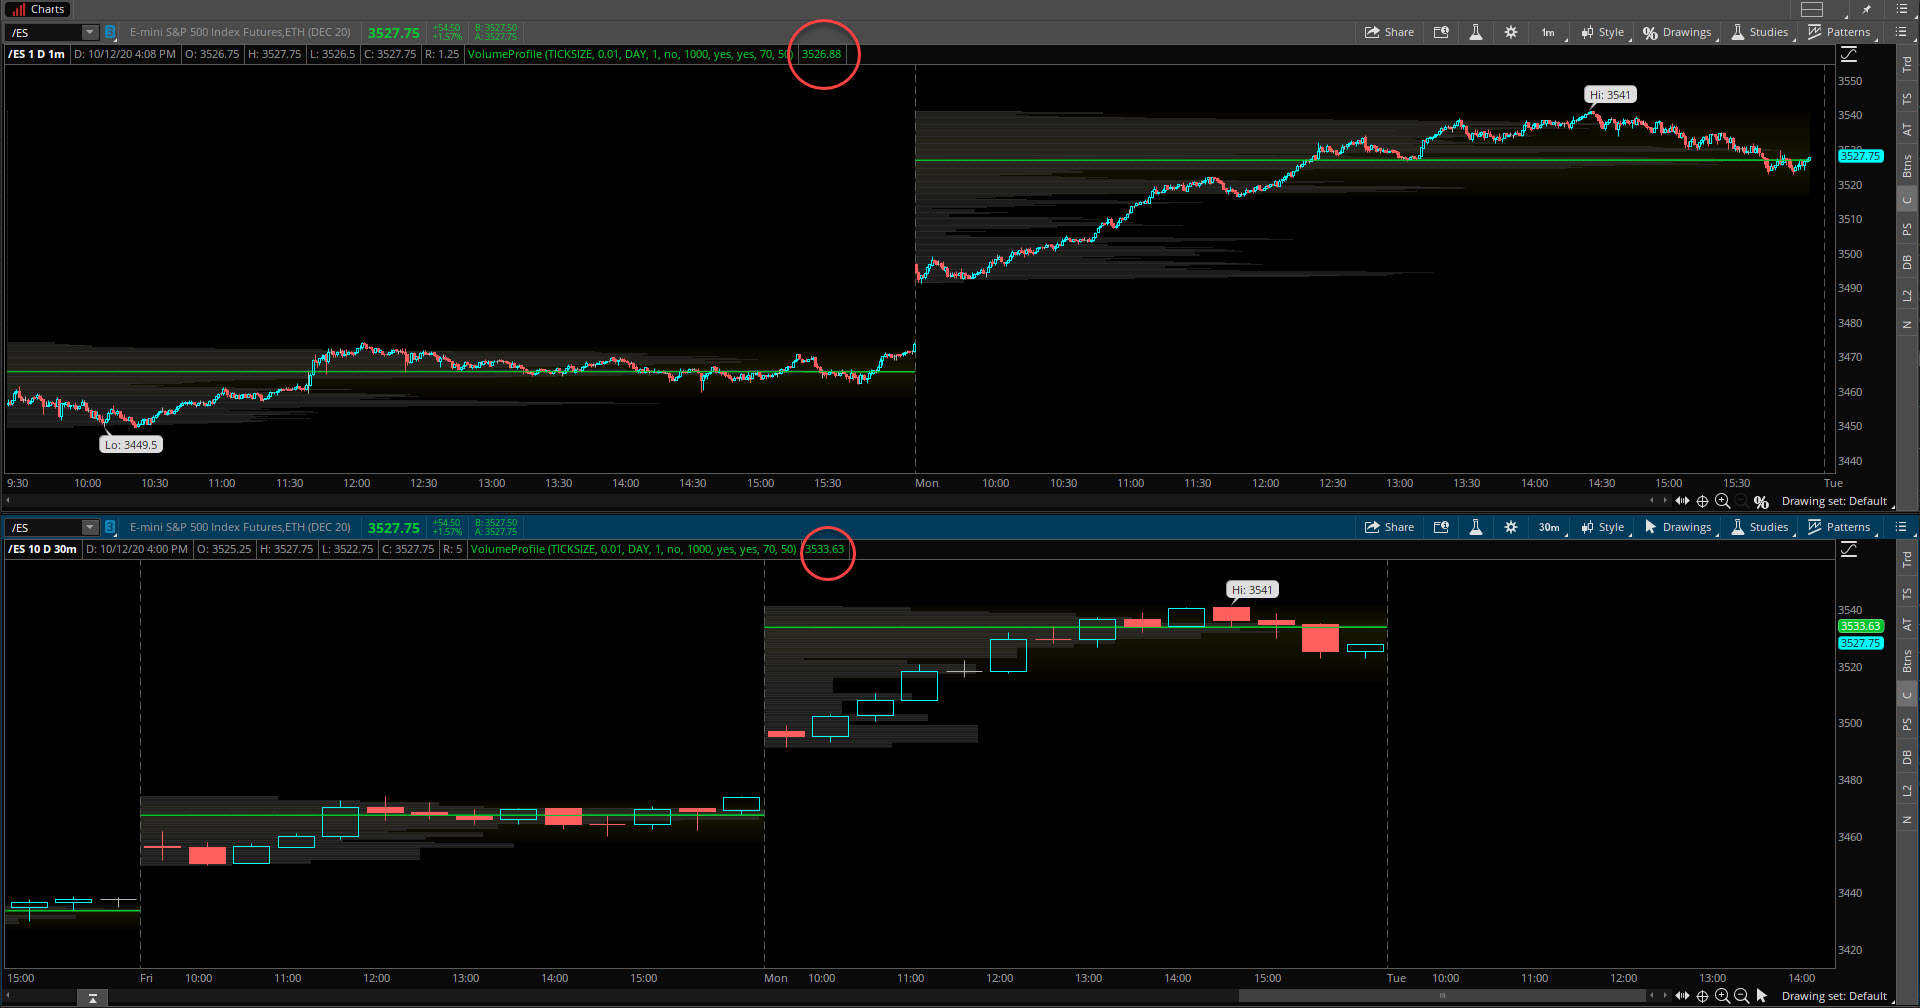
I haven't used IB data so I can not confirm if it is or isn't good for VP but typically when someone refers to data not being good for volume profile it is usually due to it not being tick data. When it is not tick data the provider often aggregates the data over the timeframe you are looking at instead of where the trades actually took place. When this happens you will notice things like VPOCs being in at different prices for the day depending on the timeframe of the chart you are use.. For example a 1 min chart may show the vpoc at 3526 but if you change it to a 30 min chart the vpoc may show 3533. Those values should not change since it is referring to the price with the most volume traded for the session.

This chart is not using IB data, it is TOS, but it illustrates the problem. The VPOCs are at different prices depending on the periodicity used for the chart. I've circled the VPOC value in the header of the chart which is showing today's trading.


2020-10-12_16-08-39


Follow me on X Reply With Quote


Last Updated on October 12, 2020


© 2026 NexusFi®, s.a., All Rights Reserved.
Av Ricardo J. Alfaro, Century Tower, Panama City, Panama, Ph: +507 833-9432 (Panama and Intl), +1 888-312-3001 (USA and Canada)
All information is for educational use only and is not investment advice. There is a substantial risk of loss in trading commodity futures, stocks, options and foreign exchange products. Past performance is not indicative of future results.
About Us - Contact Us - Site Rules, Acceptable Use, and Terms and Conditions - Downloads - Top
no new posts